Drug Details
| General Information of the Drug (ID: DR3731) | ||||
|---|---|---|---|---|
| Name |
Bevacizumab
|
|||
| Synonyms |
Bevacizumab (ophthalmic slow-release tissue tablet)
Click to Show/Hide
|
|||
| Molecular Type |
Antibody
|
|||
| Disease | Colorectal cancer [ICD-11: 2B91] | Approved | [1] | |
| ADMET Property |
Clearance
The clearance of drug is 0.207 L/day
Half-life
The concentration or amount of drug in body reduced by one-half in 20 days
Metabolism
The drug is metabolized via the liver
Vd
The volume of distribution (Vd) of drug is 3.29 L
Click to Show/Hide
|
|||
| Click to Show/Hide the Molecular Information and External Link(s) of This Natural Product | ||||
| TTD Drug ID | ||||
| DrugBank ID | ||||
| Combinatorial Therapeutic Effect(s) Validated Clinically or Experimentally | ||||||
|---|---|---|---|---|---|---|
| α. A List of Natural Product(s) Able to Enhance the Efficacy of This Drug | ||||||
| Ellagic acid | Lagerstroemia speciosa | Click to Show/Hide the Molecular Data of This NP | ||||
| Augmenting Drug Sensitivity | Click to Show/Hide | |||||
| Representative Experiment Reporting the Effect of This Combination | [2] | |||||
| Detail(s) |
Combination Info
|
|||||
| Molecule(s)
Regulation |
Down-regulation | Expression | ABCB1 | Molecule Info |
Pathway MAP
|
|
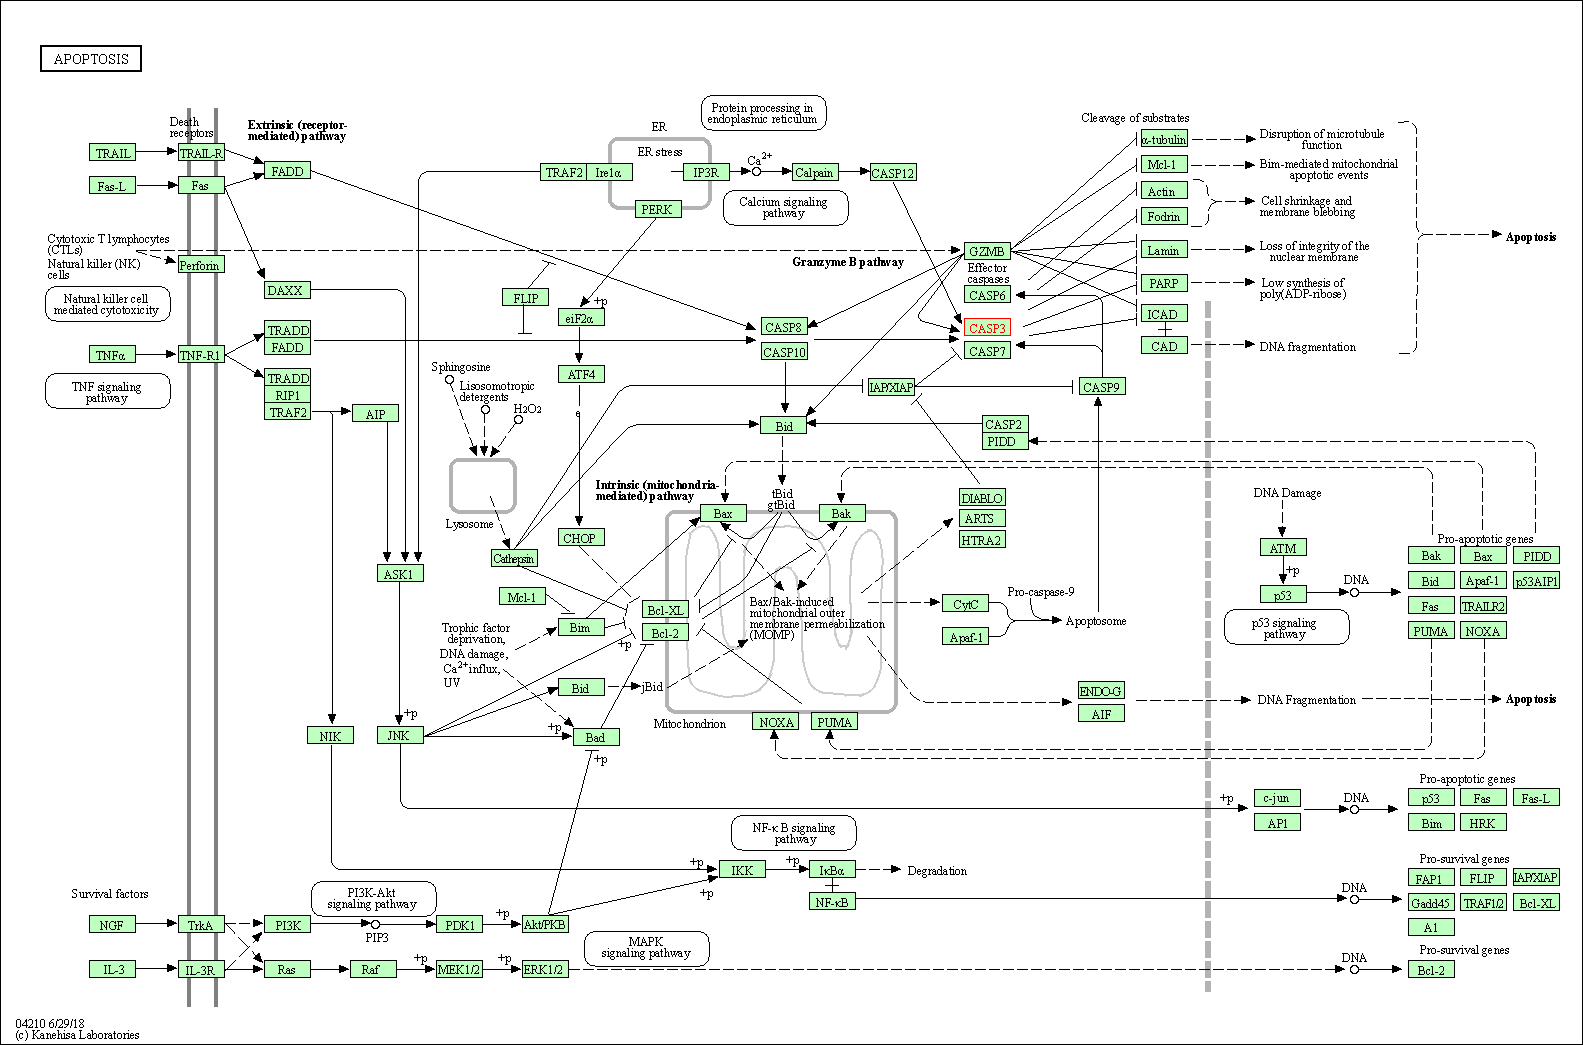
| Up-regulation | Expression | CASP3 | Molecule Info |
Pathway MAP
|
||
| Down-regulation | Expression | MGMT | Molecule Info | |||
| Up-regulation | Expression | TP53 | Molecule Info |
Pathway MAP
|
||
| In-vitro Model | C6 | CVCL_0194 | Rat malignant glioma | Rattus norvegicus | ||
| Experimental
Result(s) |
Antiproliferative efficacy of EA combined with BEV, probably through inhibition of MGMT expression and time-dependent inhibition of MDR1. | |||||
| Triamcinolone | Cladosporium | Click to Show/Hide the Molecular Data of This NP | ||||
| Achieving Therapeutic Synergy | Click to Show/Hide | |||||
| Representative Experiment Reporting the Effect of This Combination | [3] | |||||
| Detail(s) |
Combination Info
|
|||||
| In-vivo Model | A case report | |||||
| Experimental
Result(s) |
Combination in close sequence resulted in a dramatic improvement in vision and cystoid macular edema. | |||||
| Target and Pathway | ||||
|---|---|---|---|---|
| Target(s) | Vascular endothelial growth factor A (VEGFA) | Molecule Info | [1] | |
| KEGG Pathway | Ras signaling pathway | Click to Show/Hide | ||
| 2 | Rap1 signaling pathway | |||
| 3 | Cytokine-cytokine receptor interaction | |||
| 4 | HIF-1 signaling pathway | |||
| 5 | mTOR signaling pathway | |||
| 6 | PI3K-Akt signaling pathway | |||
| 7 | VEGF signaling pathway | |||
| 8 | Focal adhesion | |||
| 9 | Pathways in cancer | |||
| 10 | Proteoglycans in cancer | |||
| 11 | MicroRNAs in cancer | |||
| 12 | Renal cell carcinoma | |||
| 13 | Pancreatic cancer | |||
| 14 | Bladder cancer | |||
| 15 | Rheumatoid arthritis | |||
| NetPath Pathway | IL2 Signaling Pathway | Click to Show/Hide | ||
| 2 | EGFR1 Signaling Pathway | |||
| 3 | TGF_beta_Receptor Signaling Pathway | |||
| 4 | TSH Signaling Pathway | |||
| 5 | Leptin Signaling Pathway | |||
| 6 | FSH Signaling Pathway | |||
| Panther Pathway | Angiogenesis | Click to Show/Hide | ||
| 2 | VEGF signaling pathway | |||
| Pathway Interaction Database | Glypican 1 network | Click to Show/Hide | ||
| 2 | HIF-2-alpha transcription factor network | |||
| 3 | Beta3 integrin cell surface interactions | |||
| 4 | S1P3 pathway | |||
| 5 | Signaling events mediated by TCPTP | |||
| 6 | S1P1 pathway | |||
| 7 | Alpha9 beta1 integrin signaling events | |||
| 8 | Integrins in angiogenesis | |||
| 9 | VEGFR1 specific signals | |||
| 10 | HIF-1-alpha transcription factor network | |||
| Reactome | Platelet degranulation | Click to Show/Hide | ||
| 2 | Regulation of gene expression by Hypoxia-inducible Factor | |||
| 3 | VEGF ligand-receptor interactions | |||
| 4 | VEGF binds to VEGFR leading to receptor dimerization | |||
| WikiPathways | SIDS Susceptibility Pathways | Click to Show/Hide | ||
| 2 | Hypertrophy Model | |||
| 3 | Endochondral Ossification | |||
| 4 | Focal Adhesion | |||
| 5 | Differentiation Pathway | |||
| 6 | Bladder Cancer | |||
| 7 | Regulation of Hypoxia-inducible Factor (HIF) by Oxygen | |||
| 8 | Nifedipine Activity | |||
| 9 | Aryl Hydrocarbon Receptor | |||
| 10 | Quercetin and Nf-kB/ AP-1 Induced Cell Apoptosis | |||
| 11 | Integrated Pancreatic Cancer Pathway | |||
| 12 | Oncostatin M Signaling Pathway | |||
| 13 | Allograft Rejection | |||
| 14 | Integrated Breast Cancer Pathway | |||
| 15 | Signaling by VEGF | |||
| 16 | Heart Development | |||
| 17 | Angiogenesis | |||