Drug Combination Details
| General Information of the Combination (ID: C20036) | |||||
|---|---|---|---|---|---|
| Name | Metformin NP Info | + | Sorafenib Drug Info | ||
| Structure |

|
+ |

|
||
| Disease |
Hepatocellular carcinoma
[ICD-11: 2C12]
|
Phase 2 | [1] | ||
|
Thyroid cancer
[ICD-11: 2D10]
|
Investigative | [2] | |||
| Combinatorial Therapeutic Effect(s) Validated Clinically or Experimentally | ||||||
|---|---|---|---|---|---|---|
| α. Enhancing Drug Efficacy by This Combination | ||||||
| Achieving Therapeutic Synergy | Click to Show/Hide | |||||
| Experiment 1 Reporting the Effect of This Combination | [3] | |||||
| Molecule(s)
Regulation |
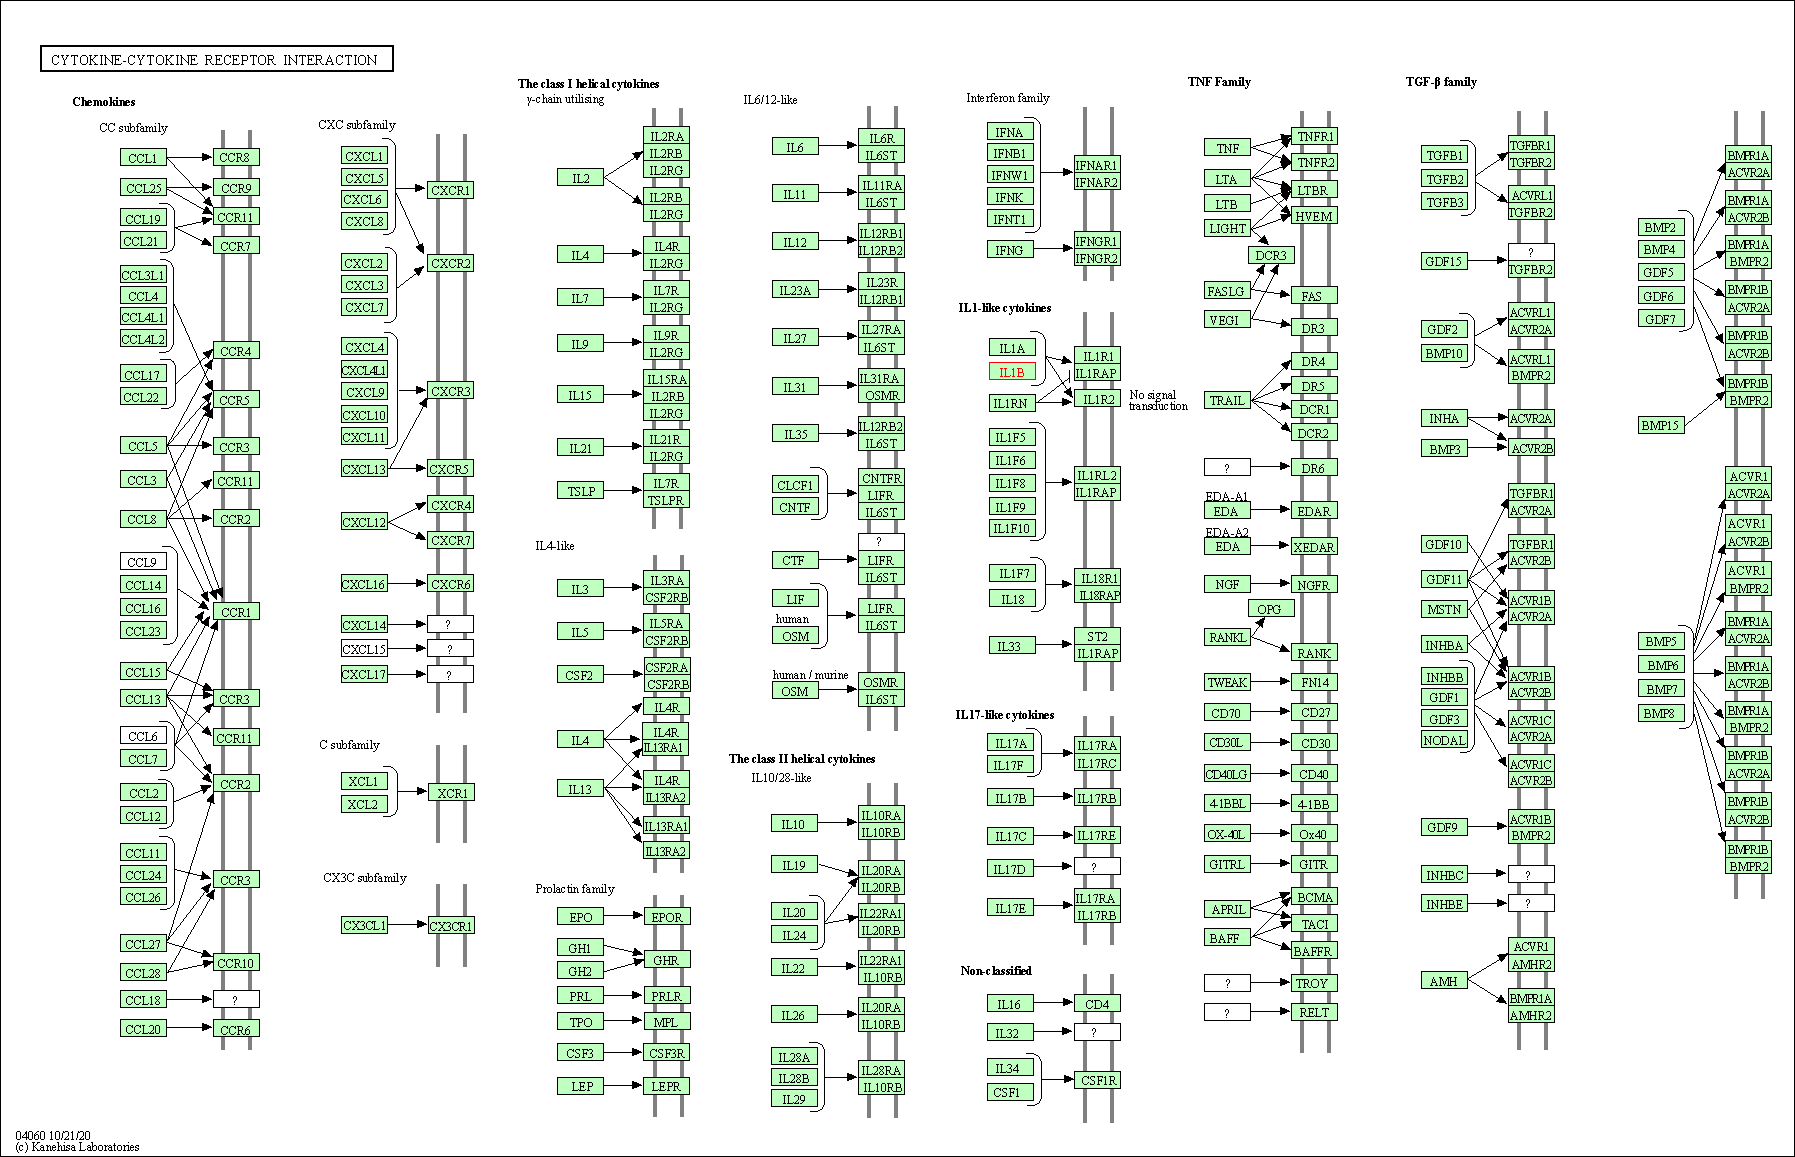
Up-regulation | Expression | IL1B | Molecule Info |
Pathway MAP
|
|
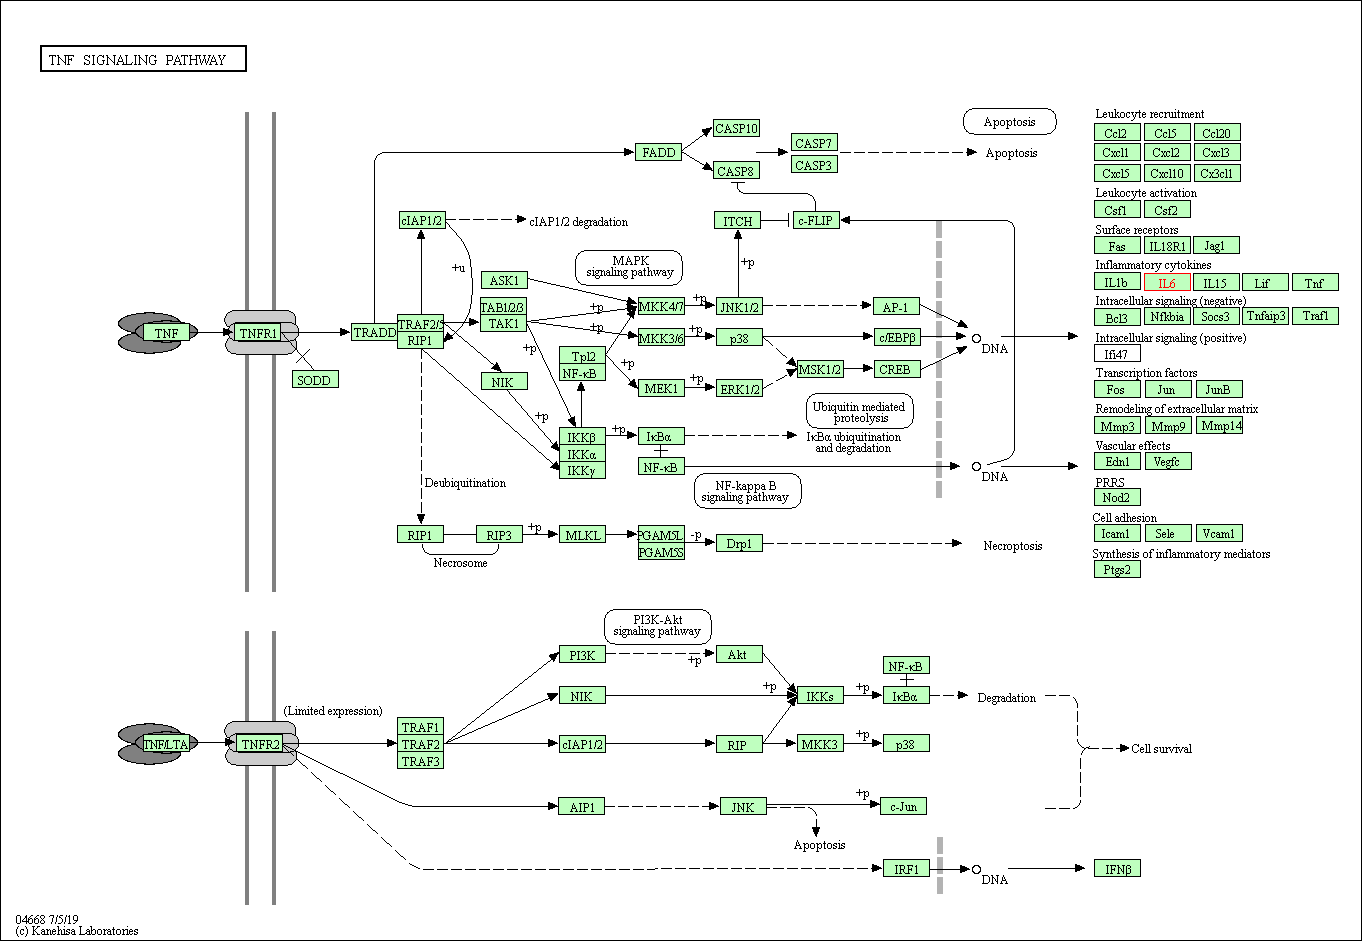
| Up-regulation | Expression | IL6 | Molecule Info |
Pathway MAP
|
||
| Up-regulation | Expression | MAP1LC3A | Molecule Info |
Pathway MAP
|
||
| Up-regulation | Expression | TNF | Molecule Info |
Pathway MAP
|
||
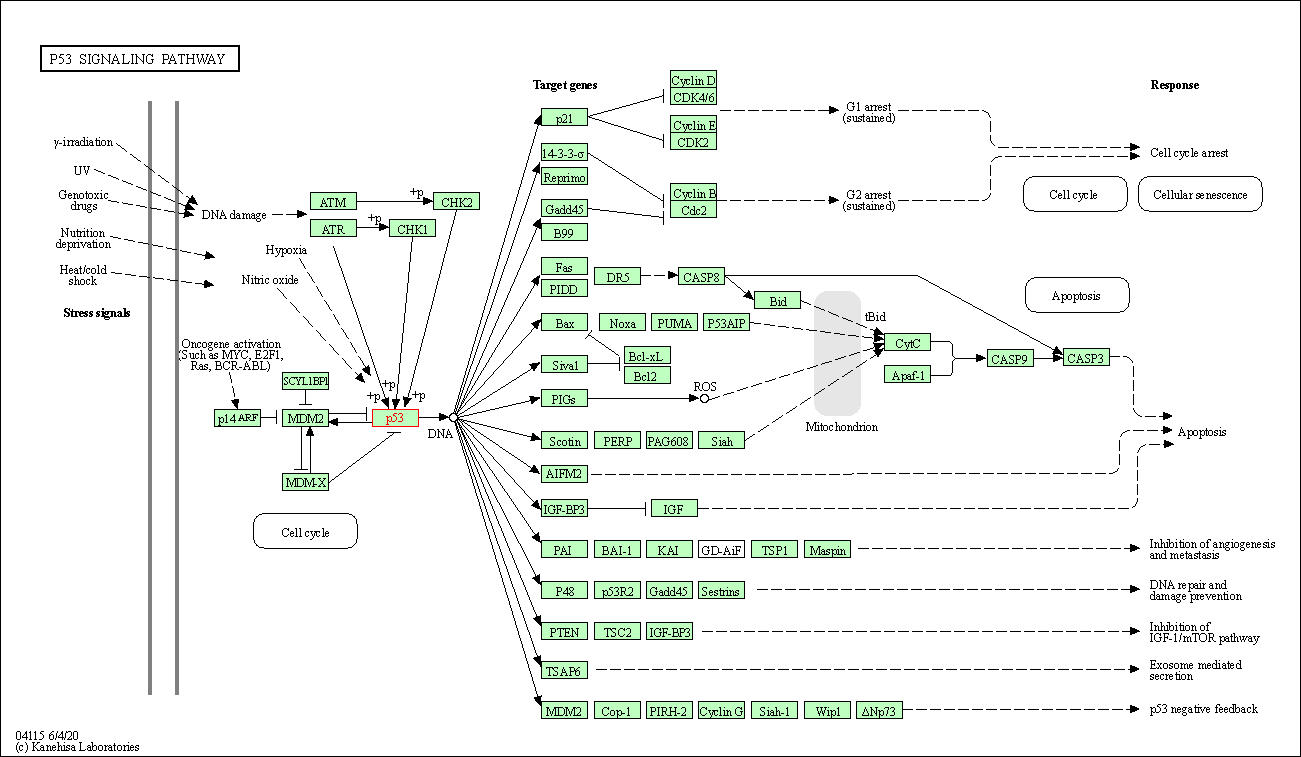
| Up-regulation | Expression | TP53 | Molecule Info |
Pathway MAP
|
||
| In-vitro Model | Hep-G2 | CVCL_0027 | Hepatocellular carcinoma | Homo sapiens | ||
| Experimental
Result(s) |
This study demonstrated cytotoxic effects of metformin and synergistic antitumor effects of sorafenib. | |||||
| Experiment 2 Reporting the Effect of This Combination | [2] | |||||
| Molecule(s)
Regulation |
Up-regulation | Expression | PRKAA2 | Molecule Info |
Pathway MAP
|
|
| In-vitro Model | HTh74 | CVCL_6288 | Thyroid gland anaplastic carcinoma | Homo sapiens | ||
| Experimental
Result(s) |
Sorafenib and metformin synergistically decreased the proliferation of ATC cell lines and the outgrowth of their derived cancer stem cells. | |||||