Natural Product (NP) Details
| General Information of the NP (ID: NP8210) | |||||
|---|---|---|---|---|---|
| Name |
Galangin
|
||||
| Synonyms |
Norizalpinin; 3,5,7-Trihydroxyflavone; 3,5,7-Trihydroxy-2-phenyl-4H-chromen-4-one; 3,5,7-triOH-Flavone; UNII-142FWE6ECS; 3,5,7-Trihydroxy-2-phenyl-4-benzopyrone; 4H-1-Benzopyran-4-one, 3,5,7-trihydroxy-2-phenyl-; EINECS 208-960-4; NSC407229; FLAVONE, 3,5,7-TRIHYDROXY-; NSC 407229; NSC-407229; 4H-Benzopyran-4-one, 3,5,7-trihydroxy-2-phenyl-; BRN 0272179; 142FWE6ECS; 3,5,7-trihydroxy-2-phenylchromen-4-one; CHEBI:5262; CHEMBL309490; VCCRNZQBSJXYJD-UHFFFAOYSA-N; 3,5,7-trihydroxy-2-phenyl-4H-benzopyran-4-one; 548-83-4
Click to Show/Hide
|
||||
| Species Origin | Plantago major ... | Click to Show/Hide | |||
| Plantago major | |||||
| Alpinia galanga | |||||
| Disease | Brain cancer [ICD-11: 2A00] | Investigative | [1] | ||
| Structure |

|
Click to Download Mol2D MOL |
|||
| ADMET Property |
Absporption
Caco-2 Permeability
-5.353
MDCK Permeability
-4.833
PAMPA
-
HIA
- - -
Distribution
VDss
-0.52
PPB
98.2%
BBB
- - -
Metabolism
CYP1A2 inhibitor
+++
CYP1A2 substrate
-
CYP2C19 inhibitor
-
CYP2C19 substrate
- - -
CYP2C9 inhibitor
+++
CYP2C9 substrate
+++
CYP2D6 inhibitor
- - -
CYP2D6 substrate
+++
CYP3A4 inhibitor
- -
CYP3A4 substrate
- - -
CYP2B6 inhibitor
- - -
CYP2B6 substrate
- - -
CYP2C8 inhibitor
+++
HLM Stability
+++
Excretion
CLplasma
4.635
T1/2
1.052
Toxicity
DILI
++
Rat Oral Acute Toxicity
+
FDAMDD
++
Respiratory
++
Human Hepatotoxicity
-
Ototoxicity
- - -
Drug-induced Nephrotoxicity
- - -
Drug-induced Neurotoxicity
- - -
Hematotoxicity
- - -
Genotoxicity
+++
Tips: 1. For the classification endpoints, the prediction probability values are transformed into six symbols: 0-0.1 (- - -), 0.1-0.3 (- -), 0.3-0.5 (-), 0.5-0.7 (+), 0.7-0.9 (++), and 0.9-1.0 (+++).
2. Additionally, the corresponding relationships of the three labels are as follows: excellent; medium; poor.
Click to Show/Hide
|
||||
| Click to Show/Hide the Molecular Information and External Link(s) of This Natural Product | |||||
| Formula |
C15H10O5
|
||||
| PubChem CID | |||||
| Canonical SMILES |
C1=CC=C(C=C1)C2=C(C(=O)C3=C(C=C(C=C3O2)O)O)O
|
||||
| InChI |
1S/C15H10O5/c16-9-6-10(17)12-11(7-9)20-15(14(19)13(12)18)8-4-2-1-3-5-8/h1-7,16-17,19H
|
||||
| InChIKey |
VCCRNZQBSJXYJD-UHFFFAOYSA-N
|
||||
| CAS Number |
CAS 548-83-4
|
||||
| Herb ID | |||||
| ETMC ID | |||||
| SymMap ID | |||||
| TCMSP ID | |||||
| TTD Drug ID | |||||
| Combinatorial Therapeutic Effect(s) Validated Clinically or Experimentally | ||||||
|---|---|---|---|---|---|---|
| α. A List of Drug(s) Whose Efficacy can be Enhanced by This NP | ||||||
| Cisplatin | Bladder cancer | Click to Show/Hide the Molecular Data of This Drug | ||||
| Achieving Therapeutic Synergy | Click to Show/Hide | |||||
| Representative Experiment Reporting the Effect of This Combination | [2] | |||||
| Detail(s) |
Combination Info
|
|||||
| Molecule(s)
Regulation |
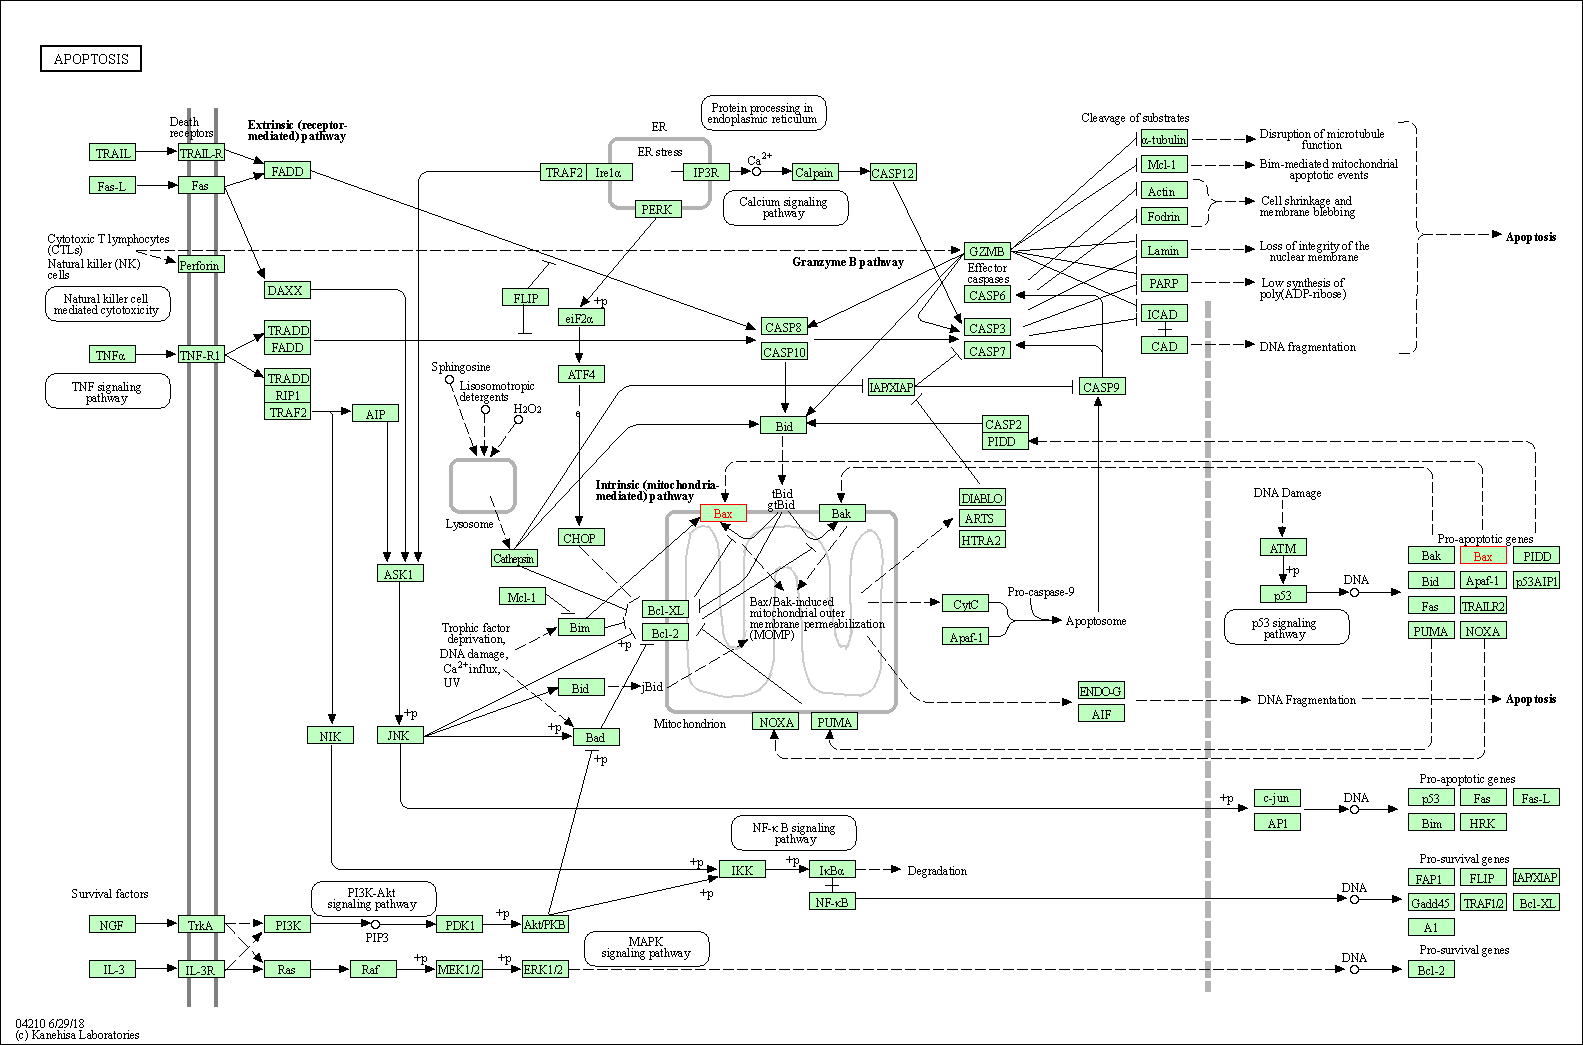
Up-regulation | Expression | BAX | Molecule Info |
Pathway MAP
|
|
| Down-regulation | Expression | BCL-2 | Molecule Info |
Pathway MAP
|
||
| Up-regulation | Expression | BID | Molecule Info |
Pathway MAP
|
||
| Down-regulation | Expression | RELA | Molecule Info |
Pathway MAP
|
||
| Down-regulation | Phosphorylation | STAT3 | Molecule Info |
Pathway MAP
|
||
| In-vitro Model | A-549 | CVCL_0023 | Lung adenocarcinoma | Homo sapiens | ||
| In-vivo Model | A549/DDP cells were harvested, 5 * 106 cells were in jected subcutaneously into the right oxter of mice. | |||||
| Experimental
Result(s) |
Galangin (GG) combined with cisplatin (DDP) to suppress human lung cancer by inhibition of STAT3-regulated NF-KappaB and Bcl-2/Bax signaling pathways. | |||||
| TNF-related apoptosis inducing ligand | Lung cancer | Click to Show/Hide the Molecular Data of This Drug | ||||
| Achieving Therapeutic Synergy | Click to Show/Hide | |||||
| Representative Experiment Reporting the Effect of This Combination | [3] | |||||
| Detail(s) |
Combination Info
|
|||||
| Molecule(s)
Regulation |
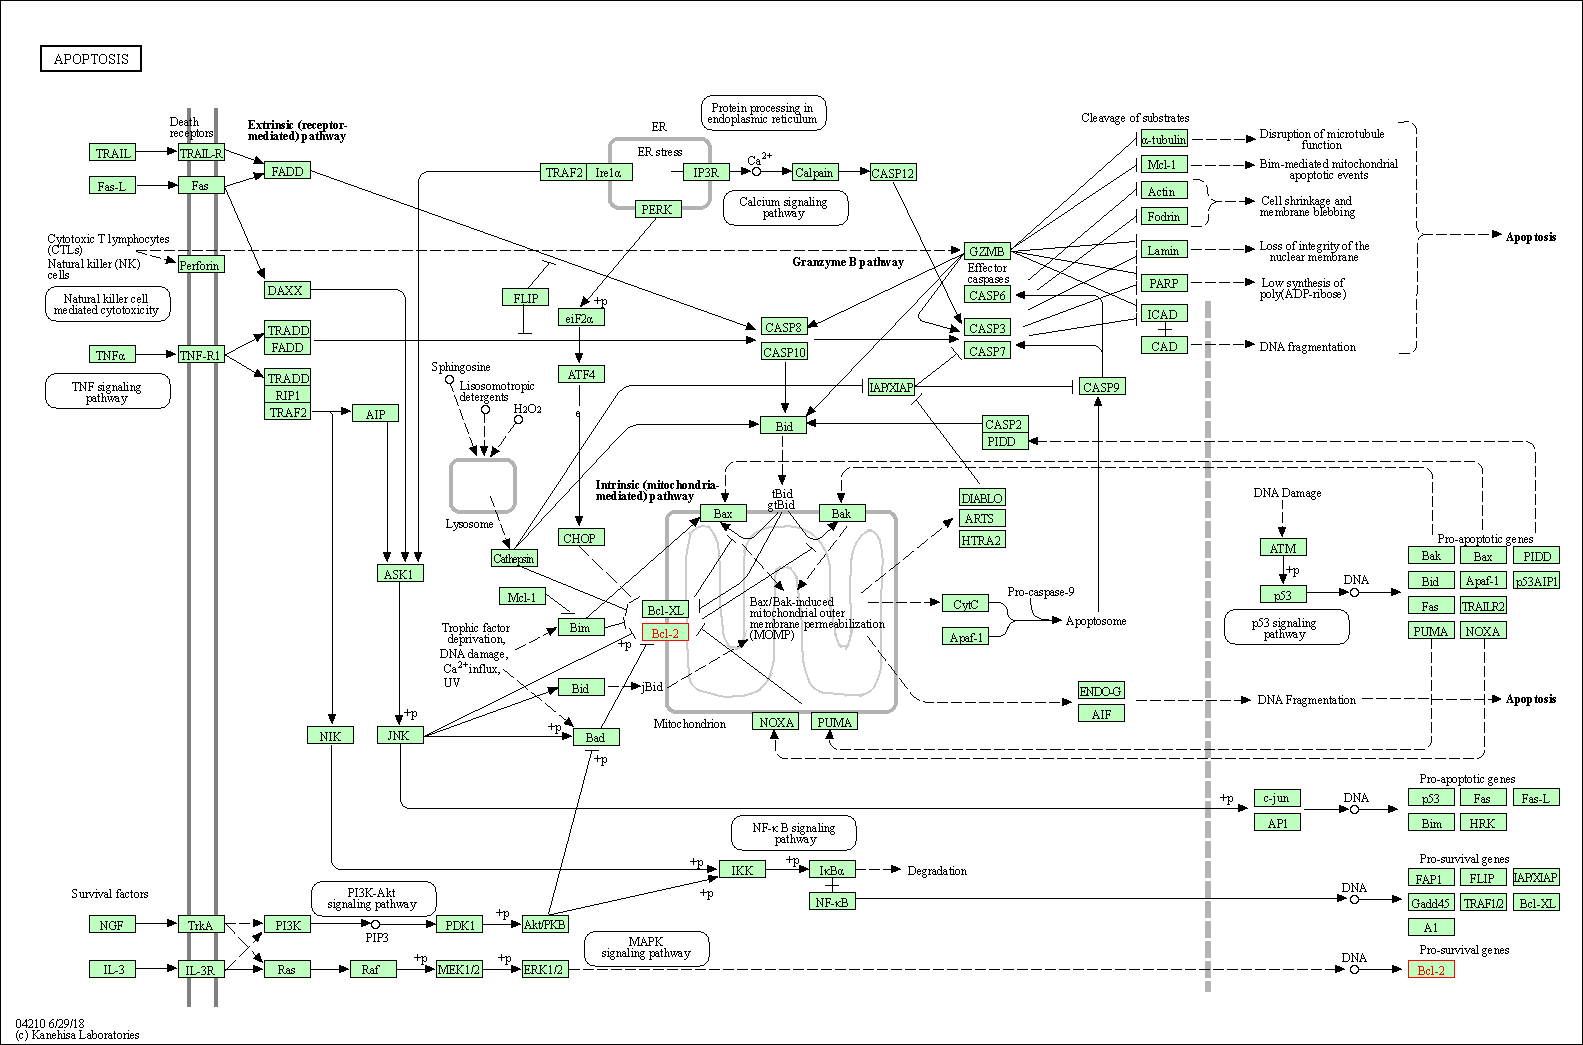
Down-regulation | Expression | BCL-2 | Molecule Info |
Pathway MAP
|
|
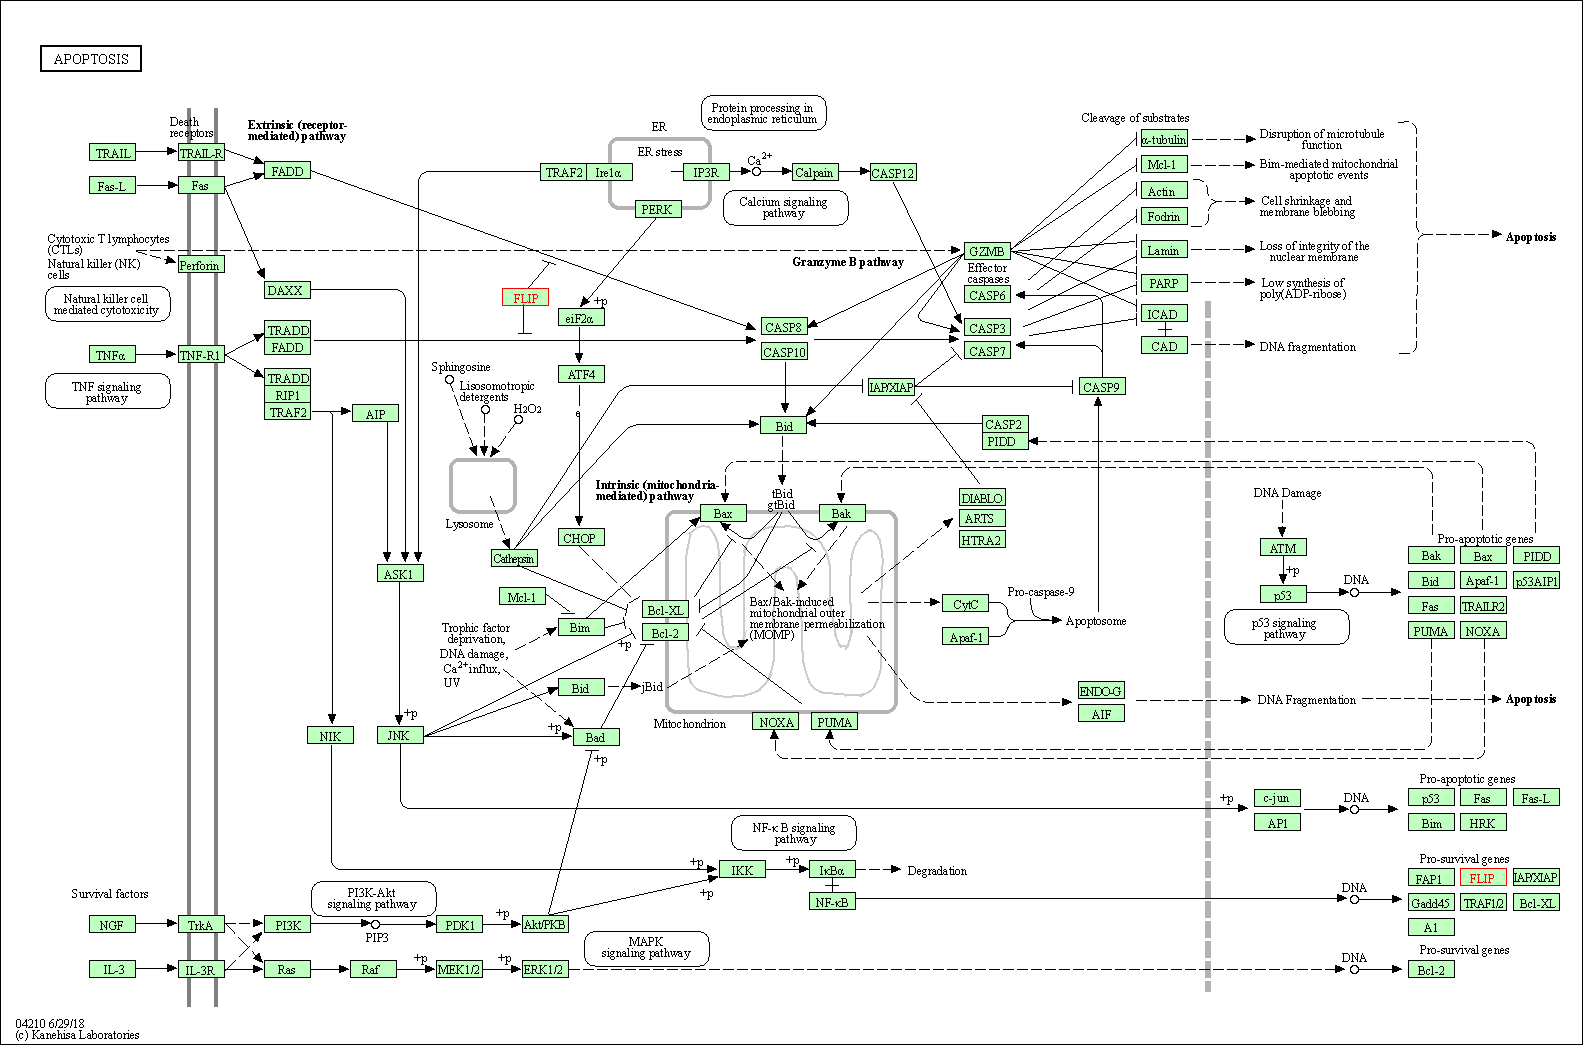
| Down-regulation | Expression | CFLAR | Molecule Info |
Pathway MAP
|
||
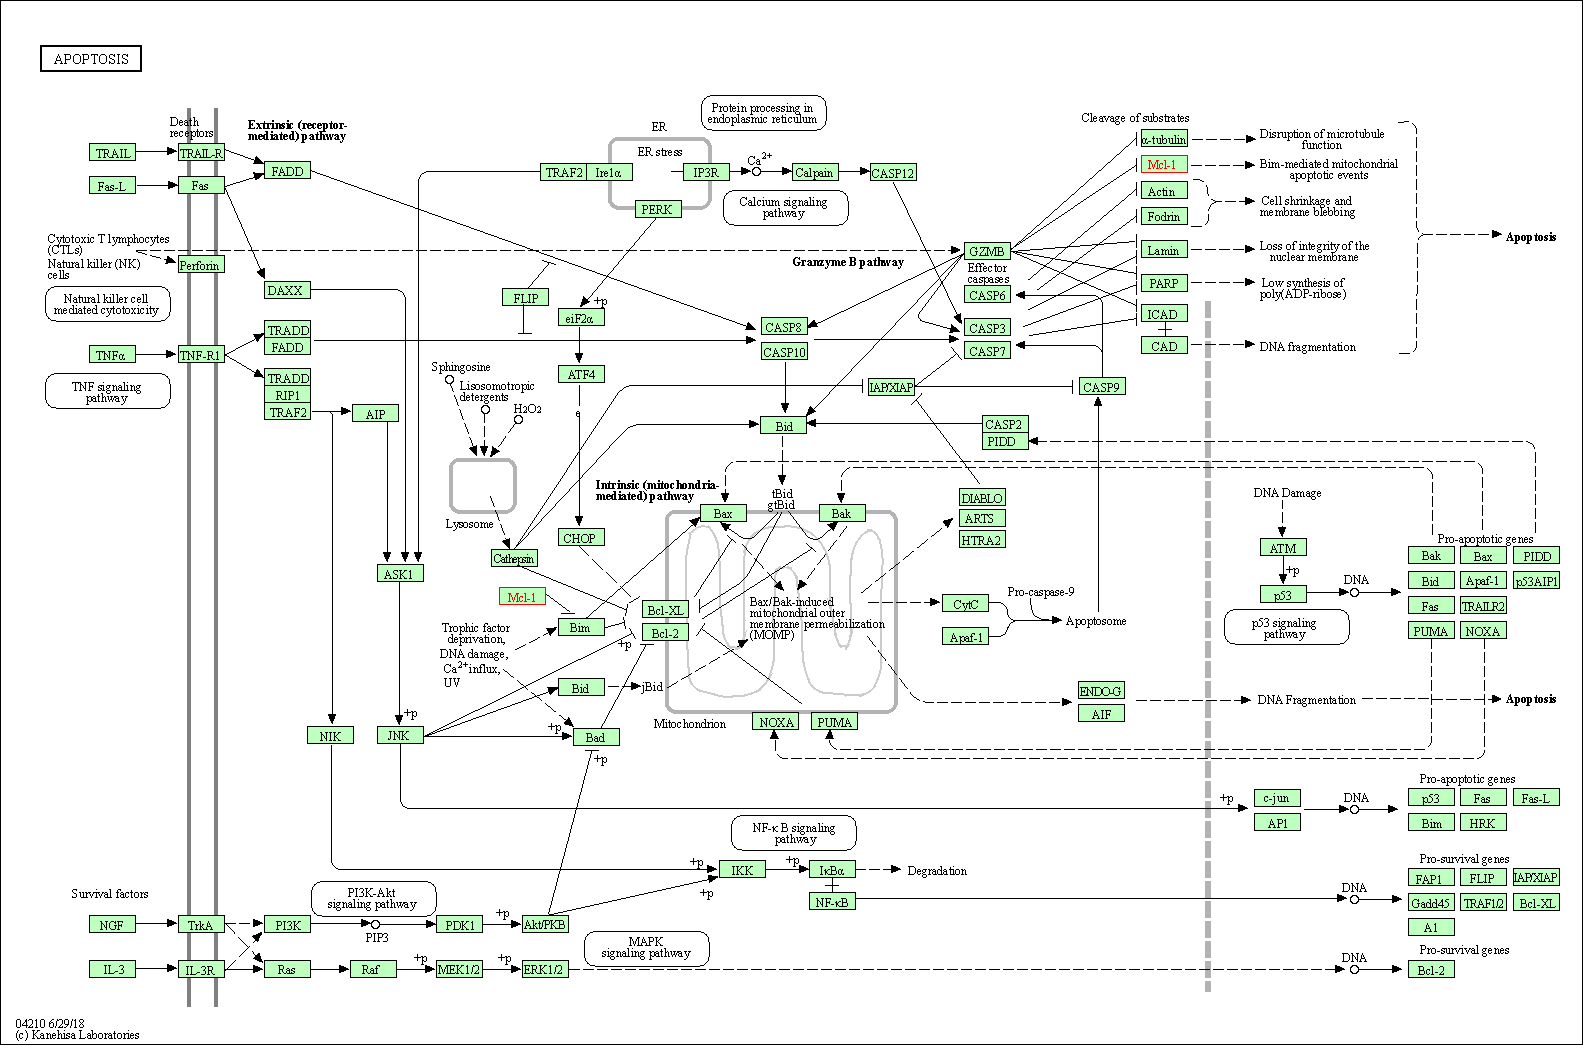
| Down-regulation | Expression | MCL1 | Molecule Info |
Pathway MAP
|
||
| Down-regulation | Expression | p105 | Molecule Info |
Pathway MAP
|
||
| In-vitro Model | Caki-1 | CVCL_0234 | Clear cell renal cell carcinoma | Homo sapiens | ||
| ACHN | CVCL_1067 | Papillary renal cell carcinoma | Homo sapiens | |||
| A-498 | CVCL_1056 | Renal cell carcinoma | Homo sapiens | |||
| Experimental
Result(s) |
Galangin sensitizes TRAIL-induced apoptosis through down-regulation of anti-apoptotic proteins in renal carcinoma Caki cells. | |||||
| Imatinib | Mantle cell lymphoma | Click to Show/Hide the Molecular Data of This Drug | ||||
| Augmenting Drug Sensitivity | Click to Show/Hide | |||||
| Representative Experiment Reporting the Effect of This Combination | [4] | |||||
| Detail(s) |
Combination Info
|
|||||
| Molecule(s)
Regulation |
Down-regulation | Expression | BCL-2 | Molecule Info |
Pathway MAP
|
|
| In-vitro Model | K-562 | CVCL_0004 | Chronic myelogenous leukemia | Homo sapiens | ||
| KCL-22 | CVCL_2091 | Chronic myelogenous leukemia | Homo sapiens | |||
| Experimental
Result(s) |
Galangin caused a decrease in Bcl-2 levels and markedly increased the apoptotic activity of imatinib both in sensitive or imatinib-resistant Bcr-Abl+ cell lines. | |||||
| Target and Pathway | ||||
|---|---|---|---|---|
| Target(s) | Adenosine A2a receptor (ADORA2A) | Molecule Info | [5] | |
| Adenosine A3 receptor (ADORA3) | Molecule Info | [6] | ||
| Cytochrome P450 1B1 (CYP1B1) | Molecule Info | [7] | ||
| BioCyc | Superpathway of tryptophan utilization | Click to Show/Hide | ||
| 2 | Superpathway of melatonin degradation | |||
| 3 | Melatonin degradation I | |||
| KEGG Pathway | Rap1 signaling pathway | Click to Show/Hide | ||
| 2 | Calcium signaling pathway | |||
| 3 | cAMP signaling pathway | |||
| 4 | Neuroactive ligand-receptor interaction | |||
| 5 | Vascular smooth muscle contraction | |||
| 6 | Parkinson's disease | |||
| 7 | Alcoholism | |||
| 8 | Steroid hormone biosynthesis | |||
| 9 | Tryptophan metabolism | |||
| 10 | Metabolism of xenobiotics by cytochrome P450 | |||
| 11 | Ovarian steroidogenesis | |||
| 12 | Chemical carcinogenesis | |||
| 13 | MicroRNAs in cancer | |||
| NetPath Pathway | TSH Signaling Pathway | Click to Show/Hide | ||
| 2 | IL4 Signaling Pathway | |||
| 3 | TGF_beta_Receptor Signaling Pathway | |||
| Pathwhiz Pathway | Intracellular Signalling Through Adenosine Receptor A2a and Adenosine | Click to Show/Hide | ||
| Pathway Interaction Database | HIF-2-alpha transcription factor network | Click to Show/Hide | ||
| Reactome | NGF-independant TRKA activation | Click to Show/Hide | ||
| 2 | Adenosine P1 receptors | |||
| 3 | G alpha (s) signalling events | |||
| 4 | Surfactant metabolism | |||
| 5 | G alpha (i) signalling events | |||
| 6 | Endogenous sterols | |||
| WikiPathways | Nucleotide GPCRs | Click to Show/Hide | ||
| 2 | Monoamine Transport | |||
| 3 | GPCRs, Class A Rhodopsin-like | |||
| 4 | NGF signalling via TRKA from the plasma membrane | |||
| 5 | GPCR ligand binding | |||
| 6 | GPCR downstream signaling | |||
| 7 | GPCRs, Other | |||
| 8 | Metapathway biotransformation | |||
| 9 | Estrogen metabolism | |||
| 10 | Benzo(a)pyrene metabolism | |||
| 11 | Tamoxifen metabolism | |||
| 12 | Tryptophan metabolism | |||
| 13 | Oxidation by Cytochrome P450 | |||
| 14 | Nuclear Receptors Meta-Pathway | |||
| 15 | Estrogen Receptor Pathway | |||
| 16 | Sulindac Metabolic Pathway | |||
| 17 | Arylhydrocarbon receptor (AhR) signaling pathway | |||
| 18 | miR-targeted genes in muscle cell - TarBase | |||
| 19 | miR-targeted genes in lymphocytes - TarBase | |||
| 20 | miR-targeted genes in epithelium - TarBase | |||
| 21 | miR-targeted genes in adipocytes - TarBase | |||
| 22 | Phase 1 - Functionalization of compounds | |||