Drug Details
| General Information of the Drug (ID: DR8611) | ||||
|---|---|---|---|---|
| Name |
Bortezomib
|
|||
| Synonyms |
[(1S)-3-methyl-1-[[(2R)-3-phenyl-2-(pyrazine-2-carbonylamino)propanoyl]amino]butyl]boronic acid; PS 341 (pharmaceutical); MG 341; NSC 681239; NCGC00168751-01; (1S,2R)-Bortezomib; Bortezomib [USAN:INN]; SCHEMBL3676; AC1L3R1E; CHEMBL1530; Bortezomib Impurity (S,S-Isomer); Bortezomib Impurity (R,R-Isomer); Bortezomib Impurity (R,S-Isomer); N-((1S)-1-Benzyl-2-(((1R)-1-(dihydroxyboranyl)-3-methylbutyl)amino)-2-oxoethyl)pyrazinecarboxamide; 1132709-16-0
Click to Show/Hide
|
|||
| Molecular Type |
Small molecule
|
|||
| Disease | Mantle cell lymphoma [ICD-11: 2A85] | Approved | [1] | |
| Structure |

|
Click to Download Mol2D MOL |
||
| ADMET Property |
Absorption Cmax
The maximum plasma concentration (Cmax) of drug is 57 mcg/L
BDDCS Class
Biopharmaceutics Drug Disposition Classification System (BDDCS) Class 1: high solubility and high permeability
Clearance
The total body clearance of drug is 102-112 L/h
Half-life
The concentration or amount of drug in body reduced by one-half in 40 - 193 hours
Metabolism
The drug is metabolized via the CYP3A4, CYP2C19, and CYP1A2
MRTD
The Maximum Recommended Therapeutic Dose (MRTD) of drug that ensured maximising efficacy and moderate side effect is 0.0836 micromolar/kg/day
Unbound Fraction
The unbound fraction of drug in plasma is 0.17%
Vd
Fluid volume that would be required to contain the amount of drug present in the body at the same concentration as in the plasma 10 L/kg
Water Solubility
The ability of drug to dissolve in water is measured as 3.3 mg/mL
Click to Show/Hide
|
|||
| Click to Show/Hide the Molecular Information and External Link(s) of This Natural Product | ||||
| Formula |
C19H25BN4O4
|
|||
| PubChem CID | ||||
| Canonical SMILES |
B(C(CC(C)C)NC(=O)C(CC1=CC=CC=C1)NC(=O)C2=NC=CN=C2)(O)O
|
|||
| InChI |
1S/C19H25BN4O4/c1-13(2)10-17(20(27)28)24-18(25)15(11-14-6-4-3-5-7-14)23-19(26)16-12-21-8-9-22-16/h3-9,12-13,15,17,27-28H,10-11H2,1-2H3,(H,23,26)(H,24,25)/t15-,17-/m0/s1
|
|||
| InChIKey |
GXJABQQUPOEUTA-RDJZCZTQSA-N
|
|||
| CAS Number |
CAS 179324-69-7
|
|||
| ChEBI ID | ||||
| GDSC | ||||
| TTD Drug ID | ||||
| DrugBank ID | ||||
| Combinatorial Therapeutic Effect(s) Validated Clinically or Experimentally | ||||||
|---|---|---|---|---|---|---|
| α. A List of Natural Product(s) Able to Enhance the Efficacy of This Drug | ||||||
| Arsenic trioxide | Realgar and orpiment | Click to Show/Hide the Molecular Data of This NP | ||||
| Achieving Therapeutic Synergy | Click to Show/Hide | |||||
| Representative Experiment Reporting the Effect of This Combination | [2] | |||||
| Detail(s) |
Combination Info
|
|||||
| Molecule(s)
Regulation |
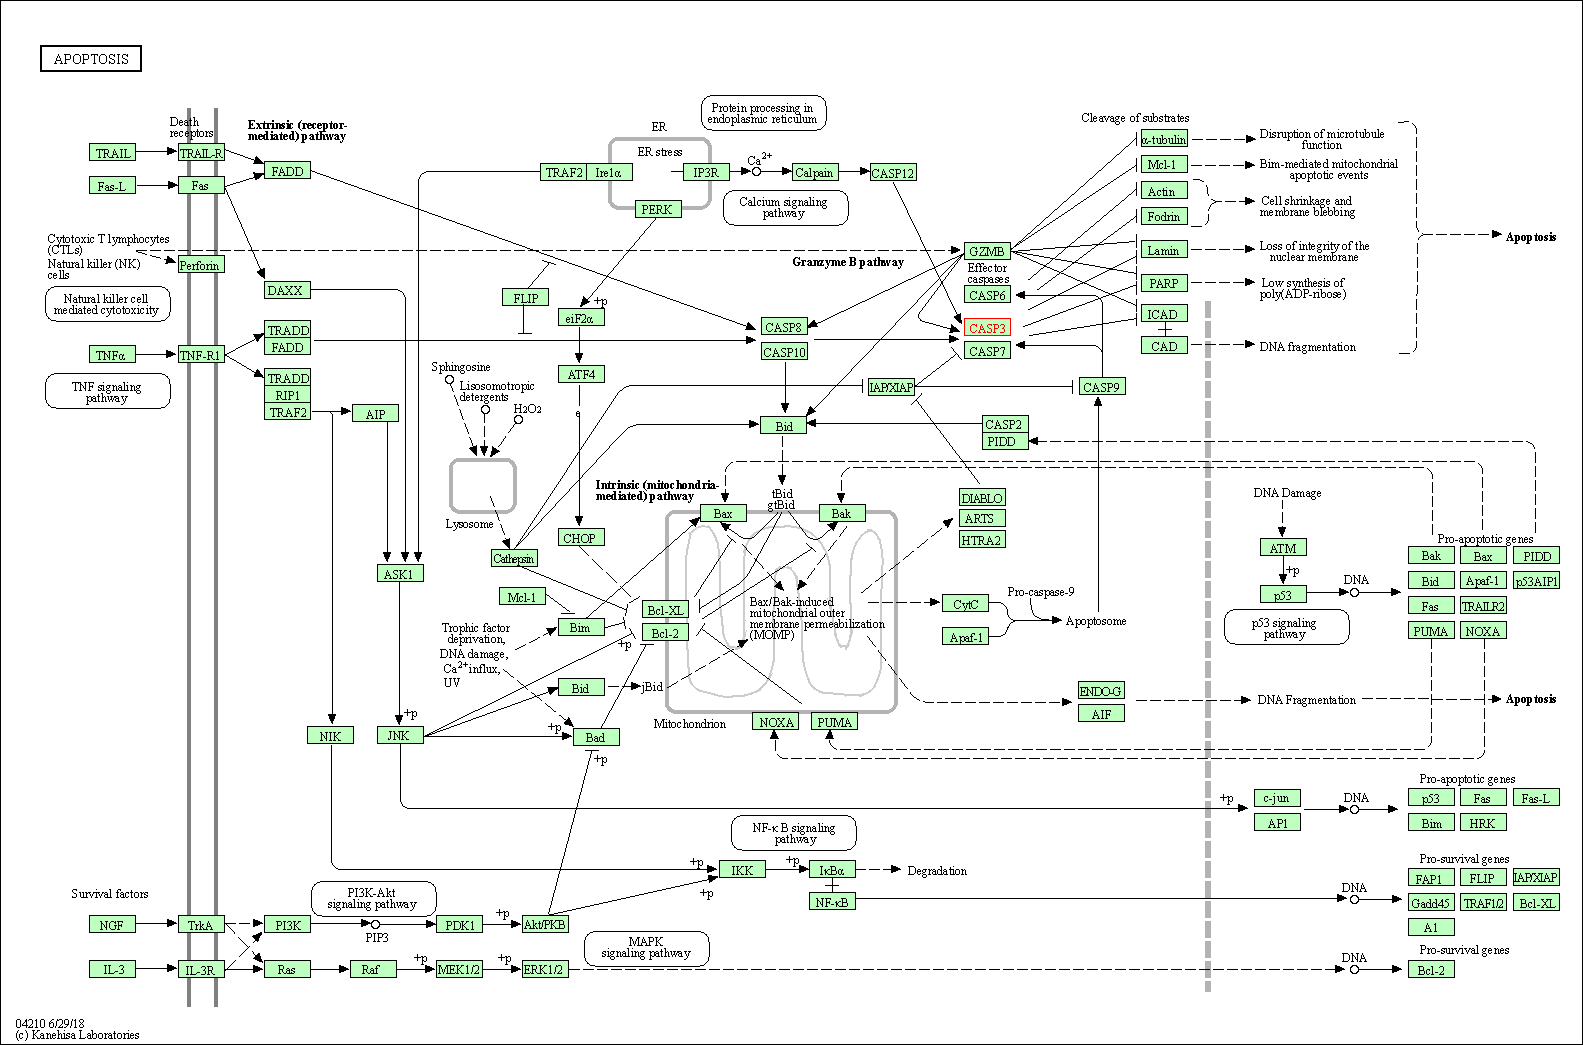
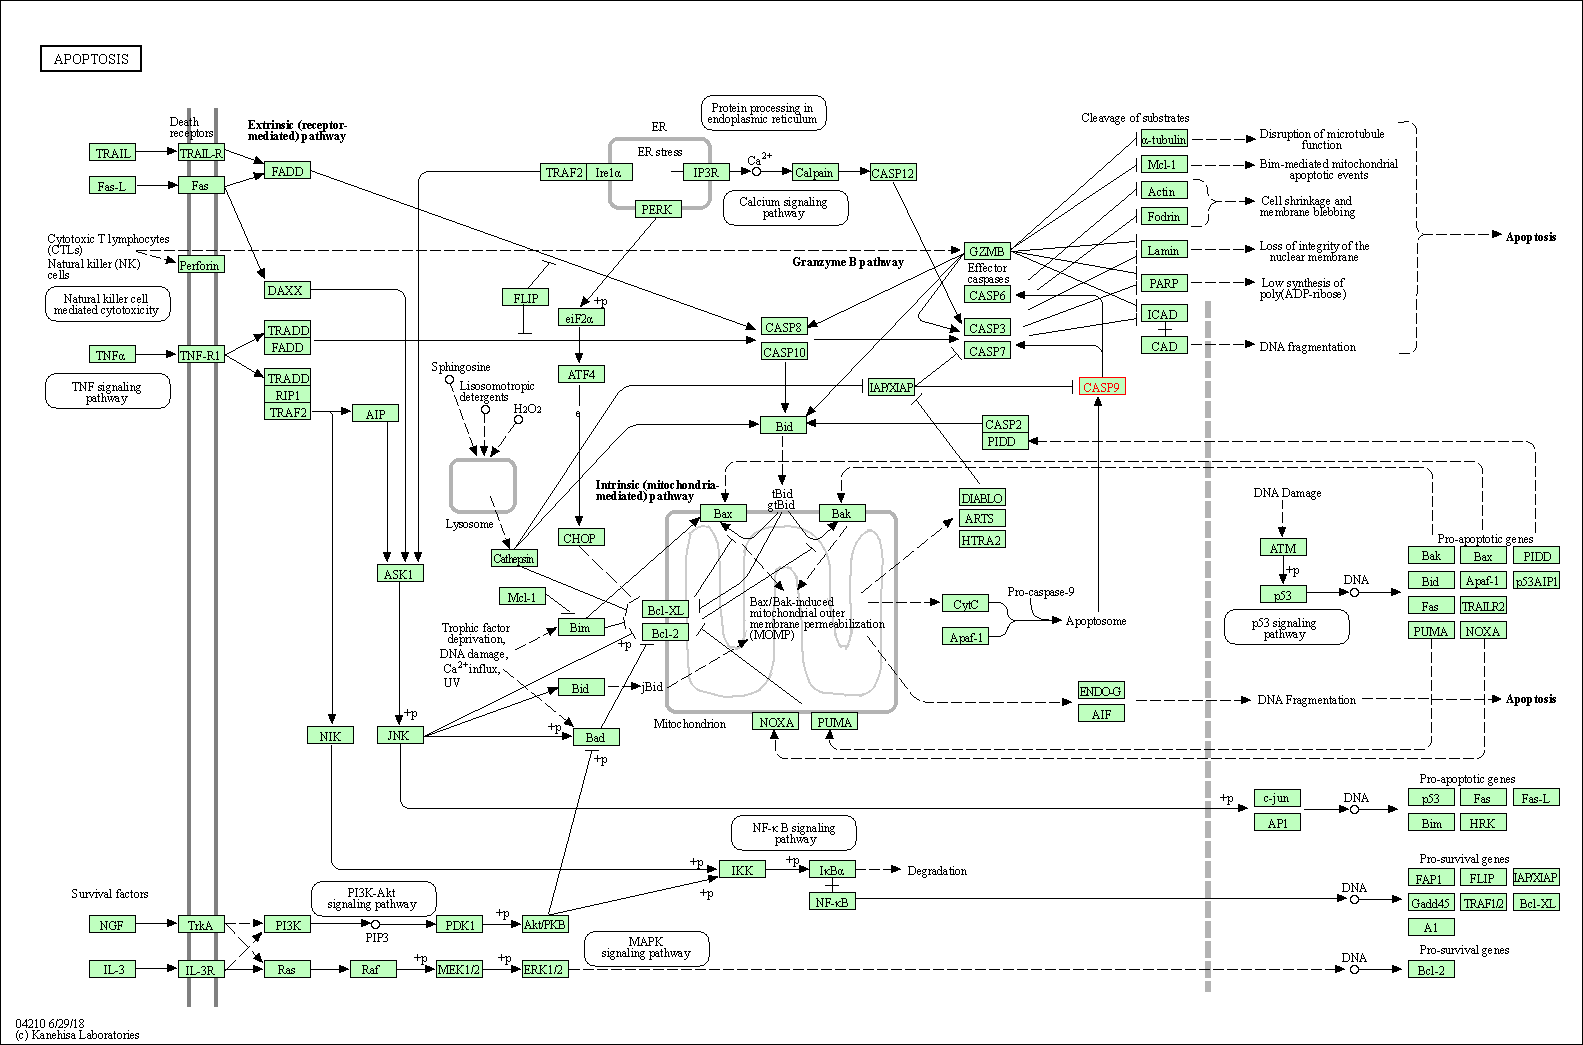
Up-regulation | Cleavage | CASP3 | Molecule Info |
Pathway MAP
|
|
| Up-regulation | Expression | MAP1LC3A | Molecule Info |
Pathway MAP
|
||
| Induction | Degradation | PRAM1 | Molecule Info | |||
| Induction | Degradation | SQSTM1 | Molecule Info |
Pathway MAP
|
||
| Biological
Regulation |
Increase | ROS generation | ||||
| Increase | Unfold protein response | |||||
| In-vitro Model | NB4 | CVCL_0005 | Acute promyelocytic leukemia | Homo sapiens | ||
| HS-5 | CVCL_3720 | Healthy | Homo sapiens | |||
| In-vivo Model | APL cells (5 * 104 cells/mouse) were injected intravenously via the tail vein into genetically compatible FVB/N recipients, without conditioning with either radiation or chemotherapy. | |||||
| Experimental
Result(s) |
A synergistic effect on combining ATO and bortezomib in vitro was noted in both ATO-sensitive and ATO-resistant APL cell lines. The mechanism of this synergy involved downregulation of the nuclear factor-KappaB pathway, increase in unfolded protein response (UPR) and an increase in reactive oxygen species generation in the malignant cell. | |||||
| Celastrol | Celastrus strigillosus | Click to Show/Hide the Molecular Data of This NP | ||||
| Achieving Therapeutic Synergy | Click to Show/Hide | |||||
| Representative Experiment Reporting the Effect of This Combination | [3] | |||||
| Detail(s) |
Combination Info
|
|||||
| Molecule(s)
Regulation |
Down-regulation | Expression | CXCR4 | Molecule Info |
Pathway MAP
|
|
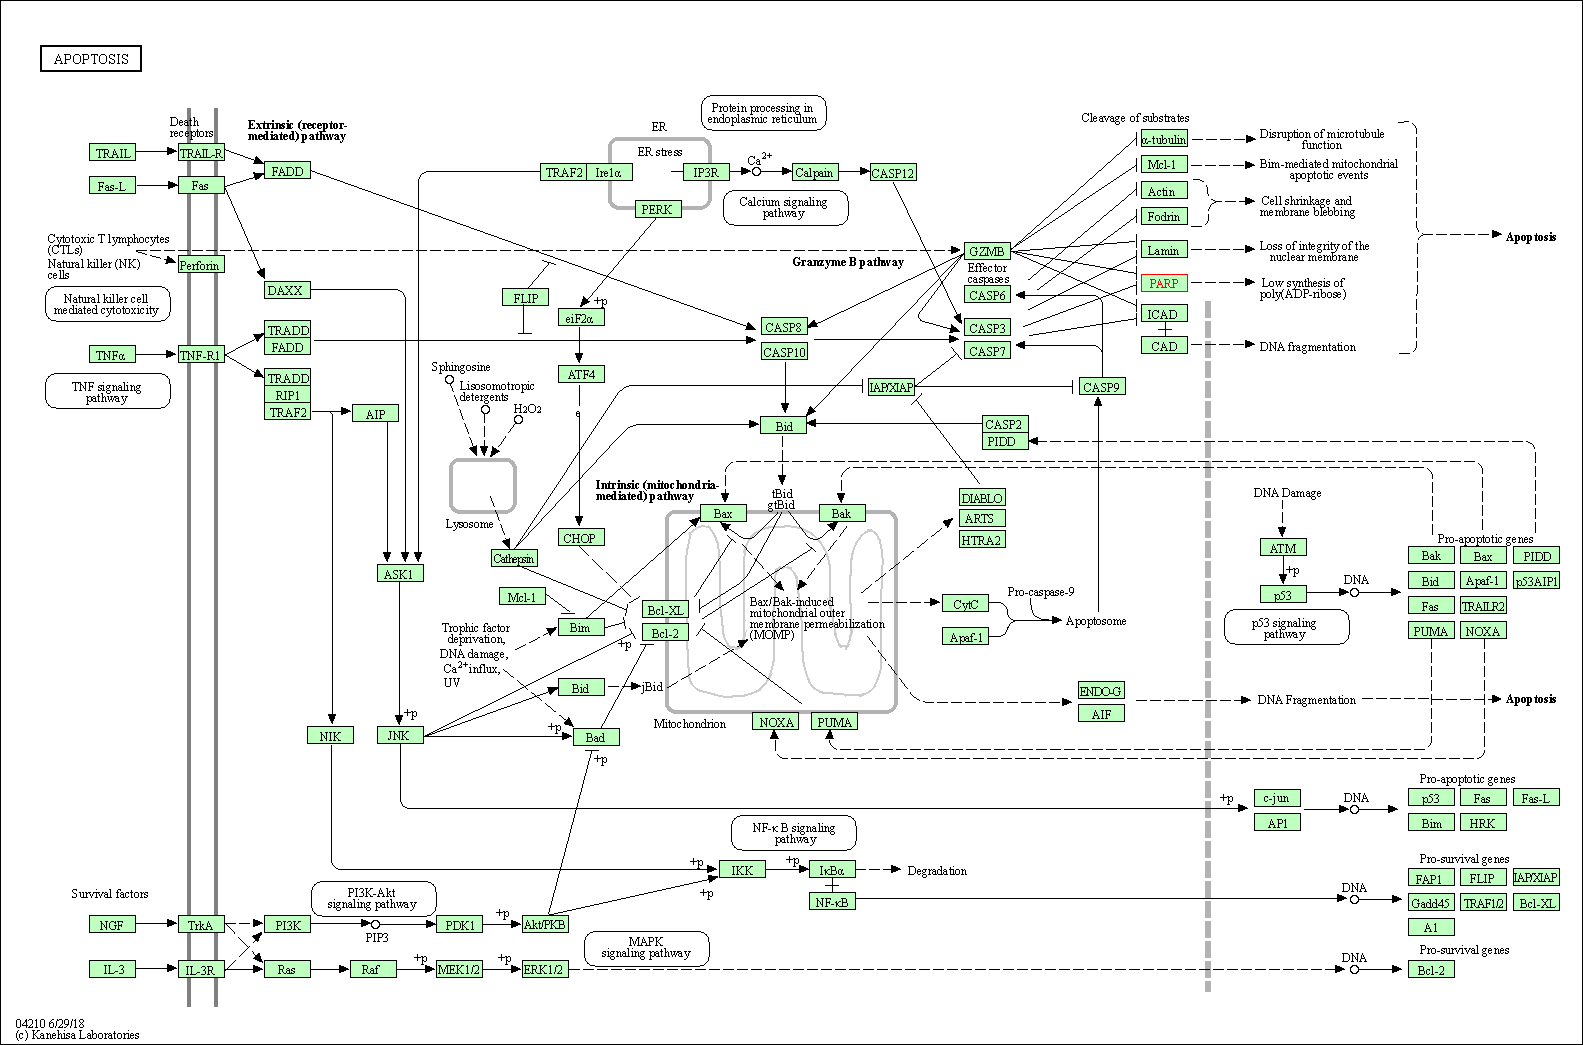
| Down-regulation | Expression | MMP-9 | Molecule Info |
Pathway MAP
|
||
| Down-regulation | Expression | p105 | Molecule Info |
Pathway MAP
|
||
| In-vitro Model | U266B1 | CVCL_0566 | Plasma cell myeloma | Homo sapiens | ||
| NCI-H929 | CVCL_1600 | Plasma cell myeloma | Homo sapiens | |||
| KMS-11 | CVCL_2989 | Plasma cell myeloma | Homo sapiens | |||
| In-vivo Model | Male athymic balb/c nude mice were implanted with 2 * 106 cells with Human MM U266 cell lines subcutaneously. | |||||
| Experimental
Result(s) |
Celastrol attenuates the invasion and migration and augments the anticancer effects of bortezomib in a xenograft mouse model of multiple myeloma. | |||||
| Curcumin | Hellenia speciosa | Click to Show/Hide the Molecular Data of This NP | ||||
| Augmenting Drug Sensitivity | Click to Show/Hide | |||||
| Representative Experiment Reporting the Effect of This Combination | [4] | |||||
| Detail(s) |
Combination Info
|
|||||
| Molecule(s)
Regulation |
Up-regulation | Phosphorylation | JNK1 | Molecule Info |
Pathway MAP
|
|
| Down-regulation | Expression | RELA | Molecule Info |
Pathway MAP
|
||
| Biological
Regulation |
Up-regulation | Increase NFKBIA stabilization | ||||
| In-vitro Model | NCI-H929 | CVCL_1600 | Plasma cell myeloma | Homo sapiens | ||
| Experimental
Result(s) |
Curcumin enhance the cytotoxicity of PS-341 by interacting with NF-kappaB, at least in part, through JNK mechanism. | |||||
| Daunorubicin | Streptomyces peucetius | Click to Show/Hide the Molecular Data of This NP | ||||
| Achieving Therapeutic Synergy | Click to Show/Hide | |||||
| Representative Experiment Reporting the Effect of This Combination | [5] | |||||
| Detail(s) |
Combination Info
|
|||||
| Molecule(s)
Regulation |
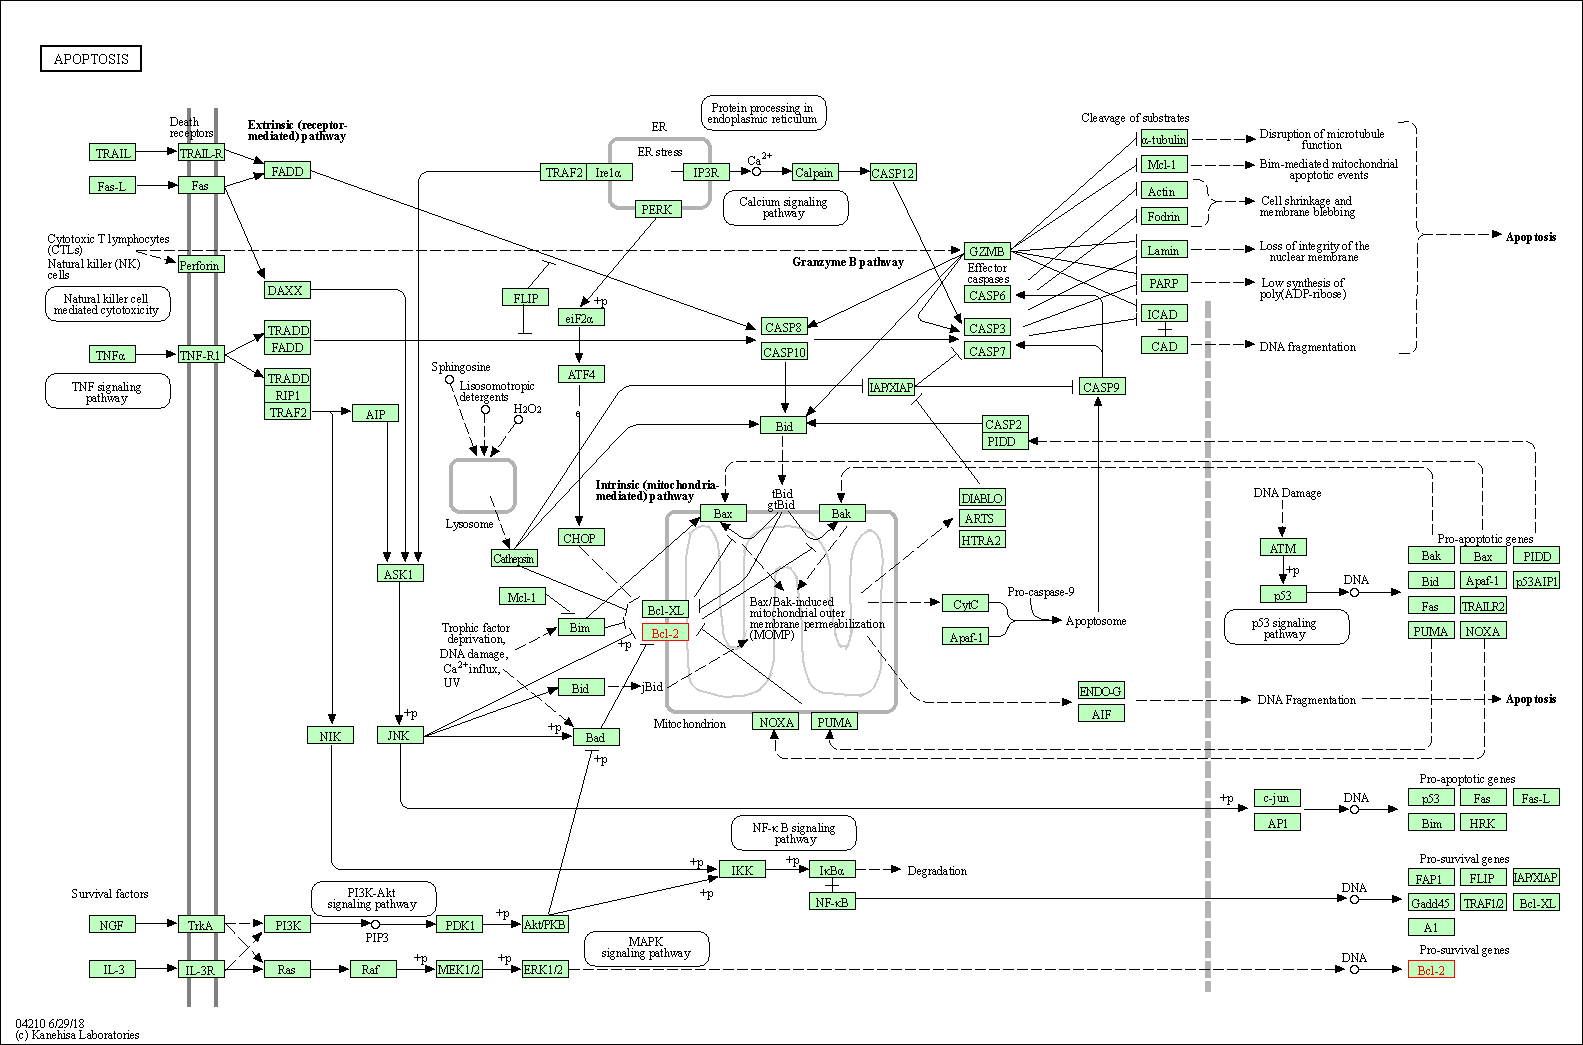
Up-regulation | Expression | BCL-2 | Molecule Info |
Pathway MAP
|
|
| Up-regulation | Cleavage | CASP3 | Molecule Info |
Pathway MAP
|
||
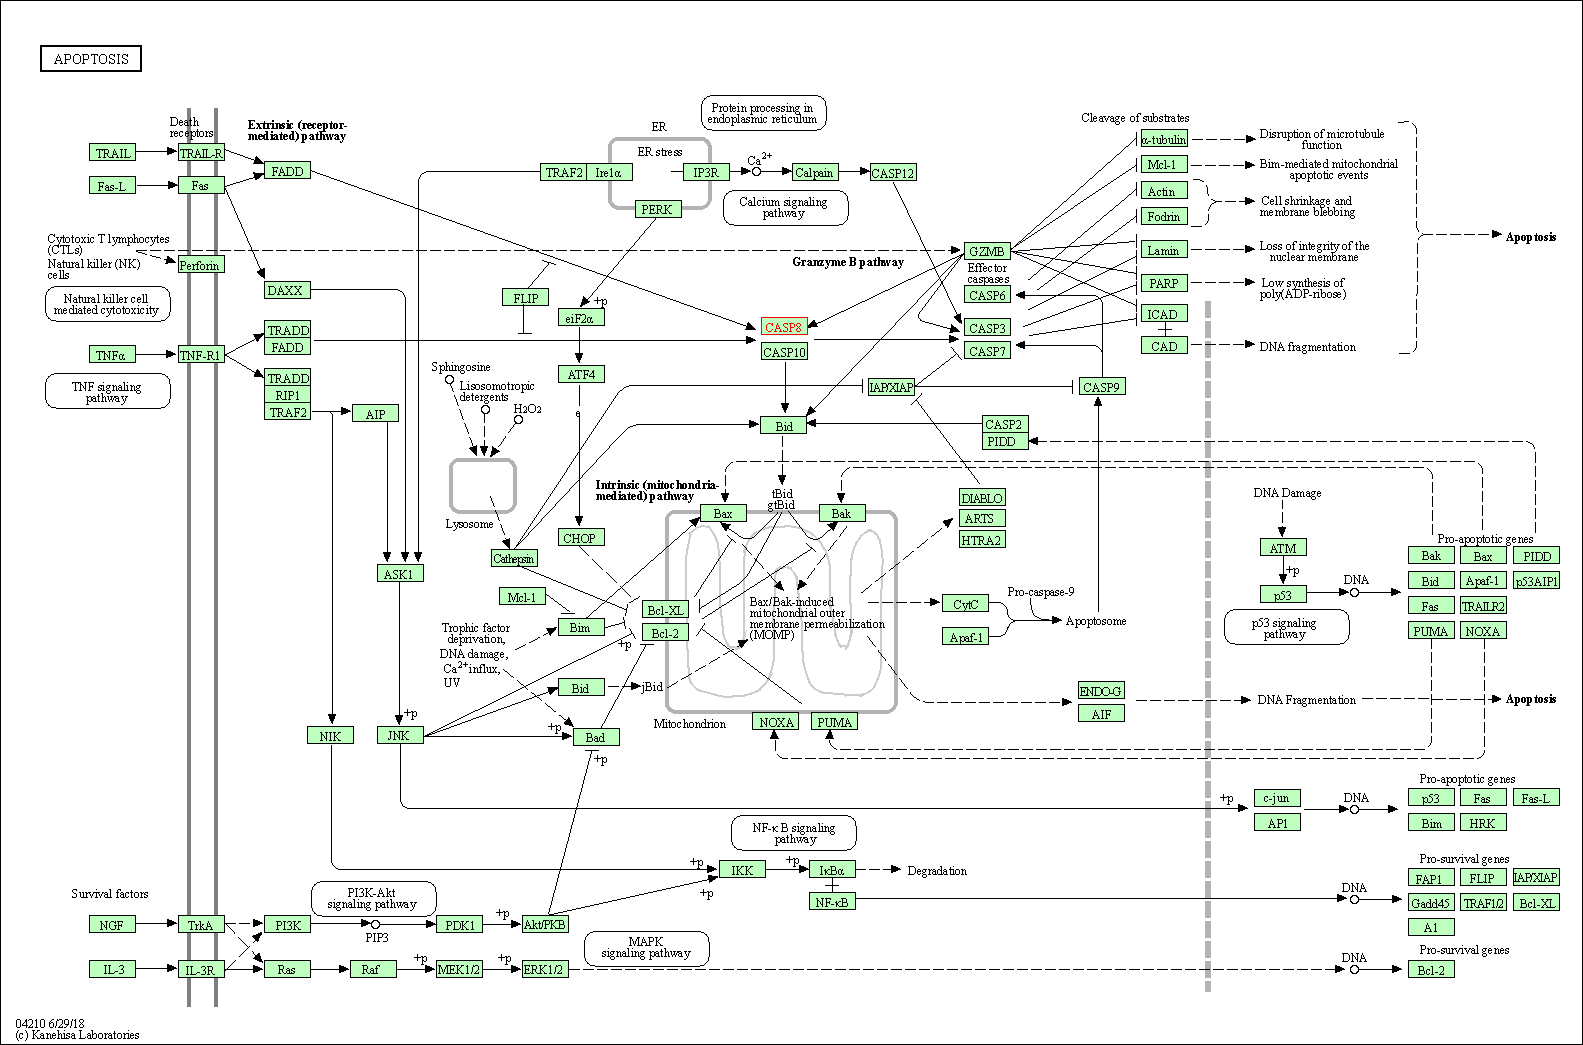
| Up-regulation | Cleavage | CASP8 | Molecule Info |
Pathway MAP
|
||
| Up-regulation | Cleavage | CASP9 | Molecule Info |
Pathway MAP
|
||
| In-vitro Model | Jurkat | CVCL_0065 | T acute lymphoblastic leukemia | Homo sapiens | ||
| MOLT-4 | CVCL_0013 | Adult T acute lymphoblastic leukemia | Homo sapiens | |||
| Daudi | CVCL_0008 | EBV-related Burkitt lymphoma | Homo sapiens | |||
| Experimental
Result(s) |
The combination of bortezomib and daunorubicin significantly enhanced their apoptosis inducing effect in T ALL cells, which may warrant further investigation in preclinical and clinical investigations. | |||||
| Epigallocatechin gallate | Hamamelis virginiana | Click to Show/Hide the Molecular Data of This NP | ||||
| Augmenting Drug Sensitivity | Click to Show/Hide | |||||
| Representative Experiment Reporting the Effect of This Combination | [6] | |||||
| Detail(s) |
Combination Info
|
|||||
| Molecule(s)
Regulation |
Up-regulation | Cleavage | CASP3 | Molecule Info |
Pathway MAP
|
|
| Up-regulation | Cleavage | CASP8 | Molecule Info |
Pathway MAP
|
||
| Up-regulation | Cleavage | CASP9 | Molecule Info |
Pathway MAP
|
||
| Down-regulation | Phosphorylation | NFKBIA | Molecule Info |
Pathway MAP
|
||
| Up-regulation | Cleavage | PARP1 | Molecule Info |
Pathway MAP
|
||
| Down-regulation | Expression and phosphorylation | RELA | Molecule Info |
Pathway MAP
|
||
| In-vitro Model | KM-3 | CVCL_0011 | Multiple myeloma | Homo sapiens | ||
| Experimental
Result(s) |
Combined EGCG and bortezomib showed synergistic anticancer effect partly via regulating NF-kappaB pathway. | |||||
| Flavopiridol | Dysoxylum binectariferum | Click to Show/Hide the Molecular Data of This NP | ||||
| Achieving Therapeutic Synergy | Click to Show/Hide | |||||
| Representative Experiment Reporting the Effect of This Combination | [7] | |||||
| Detail(s) |
Combination Info
|
|||||
| Molecule(s)
Regulation |
Down-regulation | Phosphorylation | AKT1 | Molecule Info |
Pathway MAP
|
|
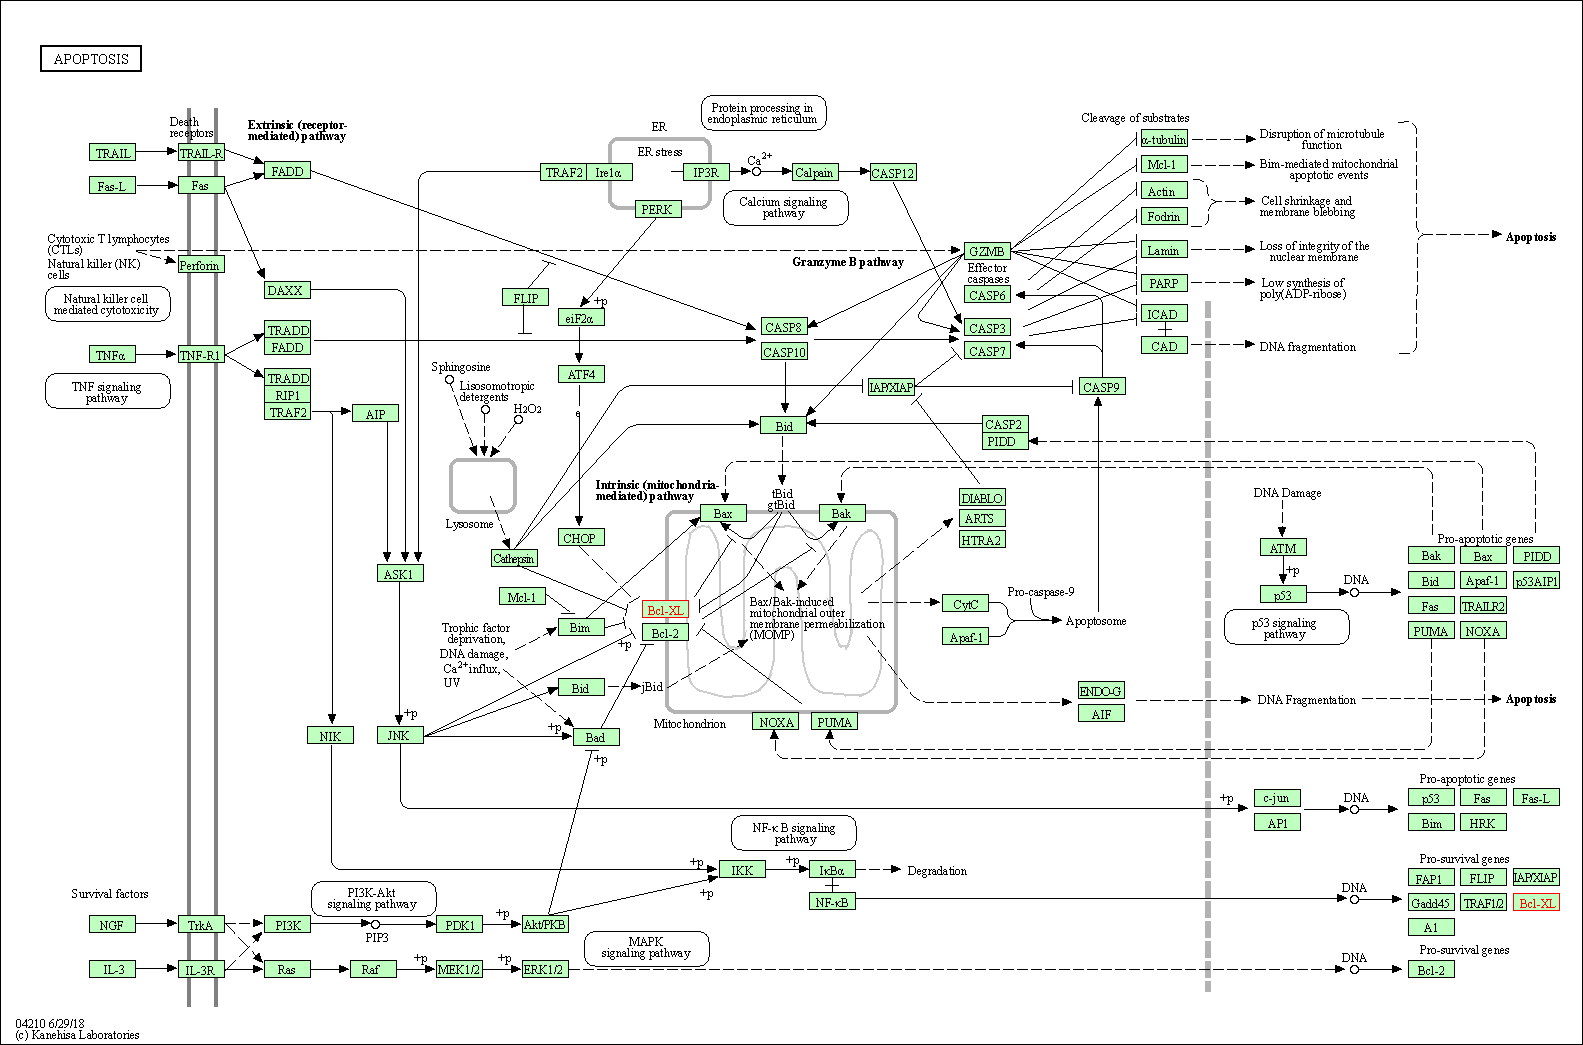
| Down-regulation | Expression | BCL-xL | Molecule Info |
Pathway MAP
|
||
| Down-regulation | Phosphorylation | BRD4 | Molecule Info |
Pathway MAP
|
||
| Down-regulation | Phosphorylation | CRKL | Molecule Info |
Pathway MAP
|
||
| Up-regulation | Expression | DIABLO | Molecule Info |
Pathway MAP
|
||
| Up-regulation | Phosphorylation | ERK2 | Molecule Info |
Pathway MAP
|
||
| Down-regulation | Phosphorylation | HCK | Molecule Info |
Pathway MAP
|
||
| Up-regulation | Phosphorylation | JNK1 | Molecule Info |
Pathway MAP
|
||
| Down-regulation | Phosphorylation | JTK8 | Molecule Info |
Pathway MAP
|
||
| Up-regulation | Phosphorylation | NFKBIA | Molecule Info |
Pathway MAP
|
||
| Down-regulation | Expression | p105 | Molecule Info |
Pathway MAP
|
||
| Down-regulation | Phosphorylation | STAT3 | Molecule Info |
Pathway MAP
|
||
| Down-regulation | Phosphorylation | STAT5B | Molecule Info |
Pathway MAP
|
||
| Biological
Regulation |
Induction | Loss of mitochondrial membrane potential | ||||
| Up-regulation | Cytochrome c release | |||||
| In-vitro Model | K-562 | CVCL_0004 | Chronic myelogenous leukemia | Homo sapiens | ||
| LAMA-84 | CVCL_0388 | Chronic myelogenous leukemia | Homo sapiens | |||
| U-937 | CVCL_0007 | Adult acute monocytic leukemia | Homo sapiens | |||
| HL-60 | CVCL_0002 | Adult acute myeloid leukemia | Homo sapiens | |||
| Raji | CVCL_0511 | EBV-related Burkitt lymphoma | Homo sapiens | |||
| Jurkat | CVCL_0065 | T acute lymphoblastic leukemia | Homo sapiens | |||
| CCRF-CEM | CVCL_0207 | T acute lymphoblastic leukemia | Homo sapiens | |||
| Experimental
Result(s) |
Bortezomib interacts synergistically with flavopiridol to induce mitochondrial dysfunction and apoptosis, blockade of the IkappaB/NF-kappaB pathway and activation of the SAPK/JNK cascade. | |||||
| Thymoquinone | Nigella sativa | Click to Show/Hide the Molecular Data of This NP | ||||
| Achieving Therapeutic Synergy | Click to Show/Hide | |||||
| Representative Experiment Reporting the Effect of This Combination | [8] | |||||
| Detail(s) |
Combination Info
|
|||||
| Molecule(s)
Regulation |
Down-regulation | Expression | BCL-2 | Molecule Info |
Pathway MAP
|
|
| Up-regulation | Expression | CASP3 | Molecule Info |
Pathway MAP
|
||
| Up-regulation | Expression | COL11A2 | Molecule Info |
Pathway MAP
|
||
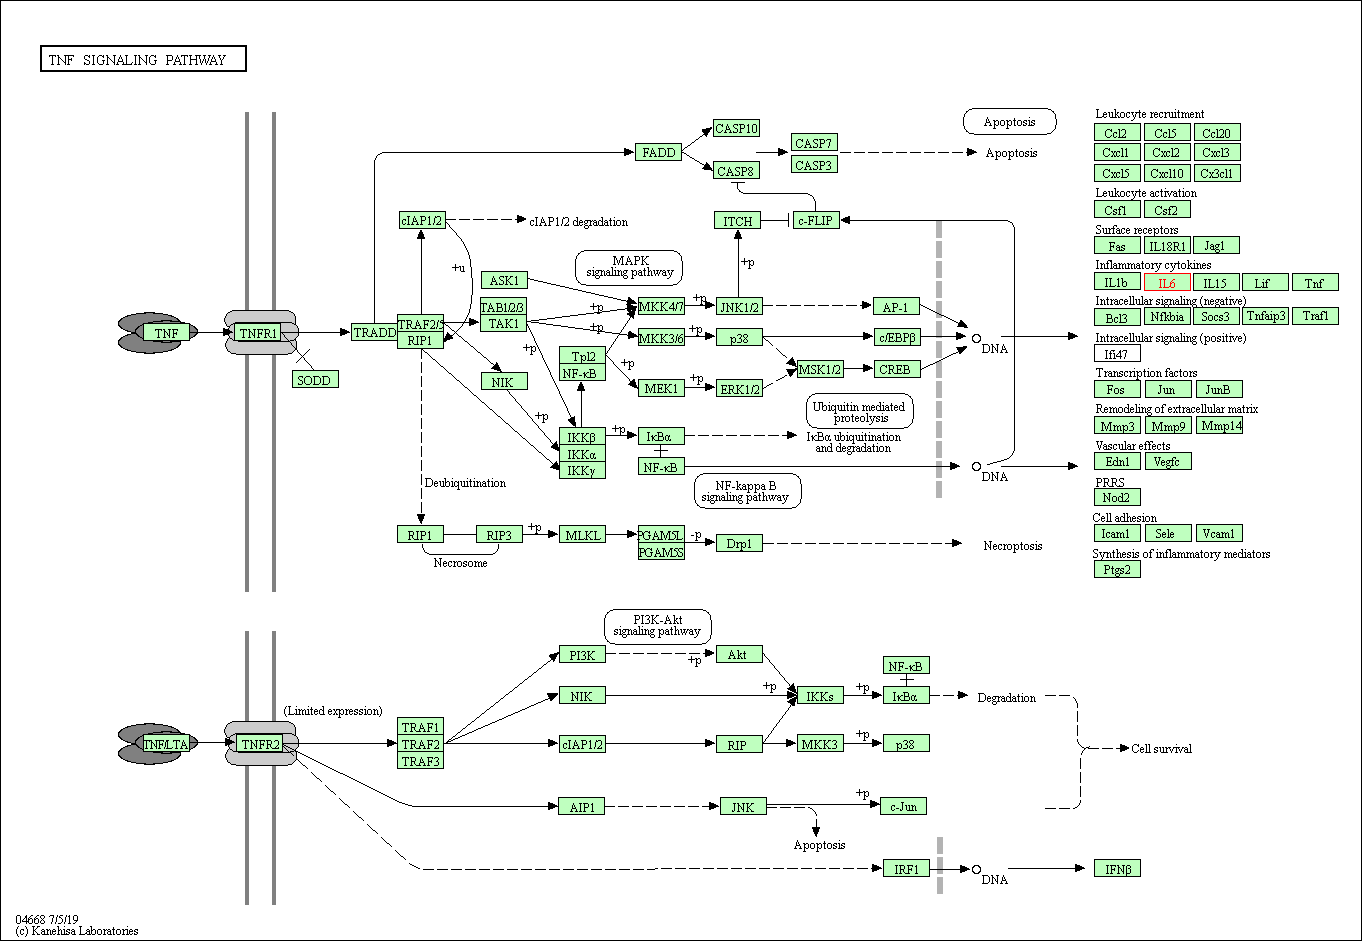
| Down-regulation | Expression | IL6 | Molecule Info |
Pathway MAP
|
||
| Down-regulation | Expression | MKI67 | Molecule Info | |||
| Down-regulation | Expression | p105 | Molecule Info |
Pathway MAP
|
||
| Down-regulation | Expression | RELA | Molecule Info |
Pathway MAP
|
||
| Down-regulation | Expression | TNF | Molecule Info |
Pathway MAP
|
||
| Down-regulation | Expression | VEGFA | Molecule Info |
Pathway MAP
|
||
| In-vitro Model | U266B1 | CVCL_0566 | Plasma cell myeloma | Homo sapiens | ||
| NCI-H929 | CVCL_1600 | Plasma cell myeloma | Homo sapiens | |||
| KMS-11 | CVCL_2989 | Plasma cell myeloma | Homo sapiens | |||
| RPMI-8226 | CVCL_0014 | Plasma cell myeloma | Homo sapiens | |||
| In-vivo Model | Five-week-old athymic nu/nu male Balb/c mice were implanted subcutaneously in the right flank with U266 cells (2 * 106 cells/100 uL of PBS/Matrigel). | |||||
| Experimental
Result(s) |
Thymoquinone overcomes chemoresistance and enhances the anticancer effects of bortezomib through abrogation of NF-KappaB regulated gene products in multiple myeloma xenograft mouse model. | |||||
| Target and Pathway | ||||
|---|---|---|---|---|
| Target(s) | Core proteasome 20S complex (PS 20S) | Molecule Info | [9] | |
| Nuclear factor NF-kappa-B (NFKB) | Molecule Info | [10] | ||
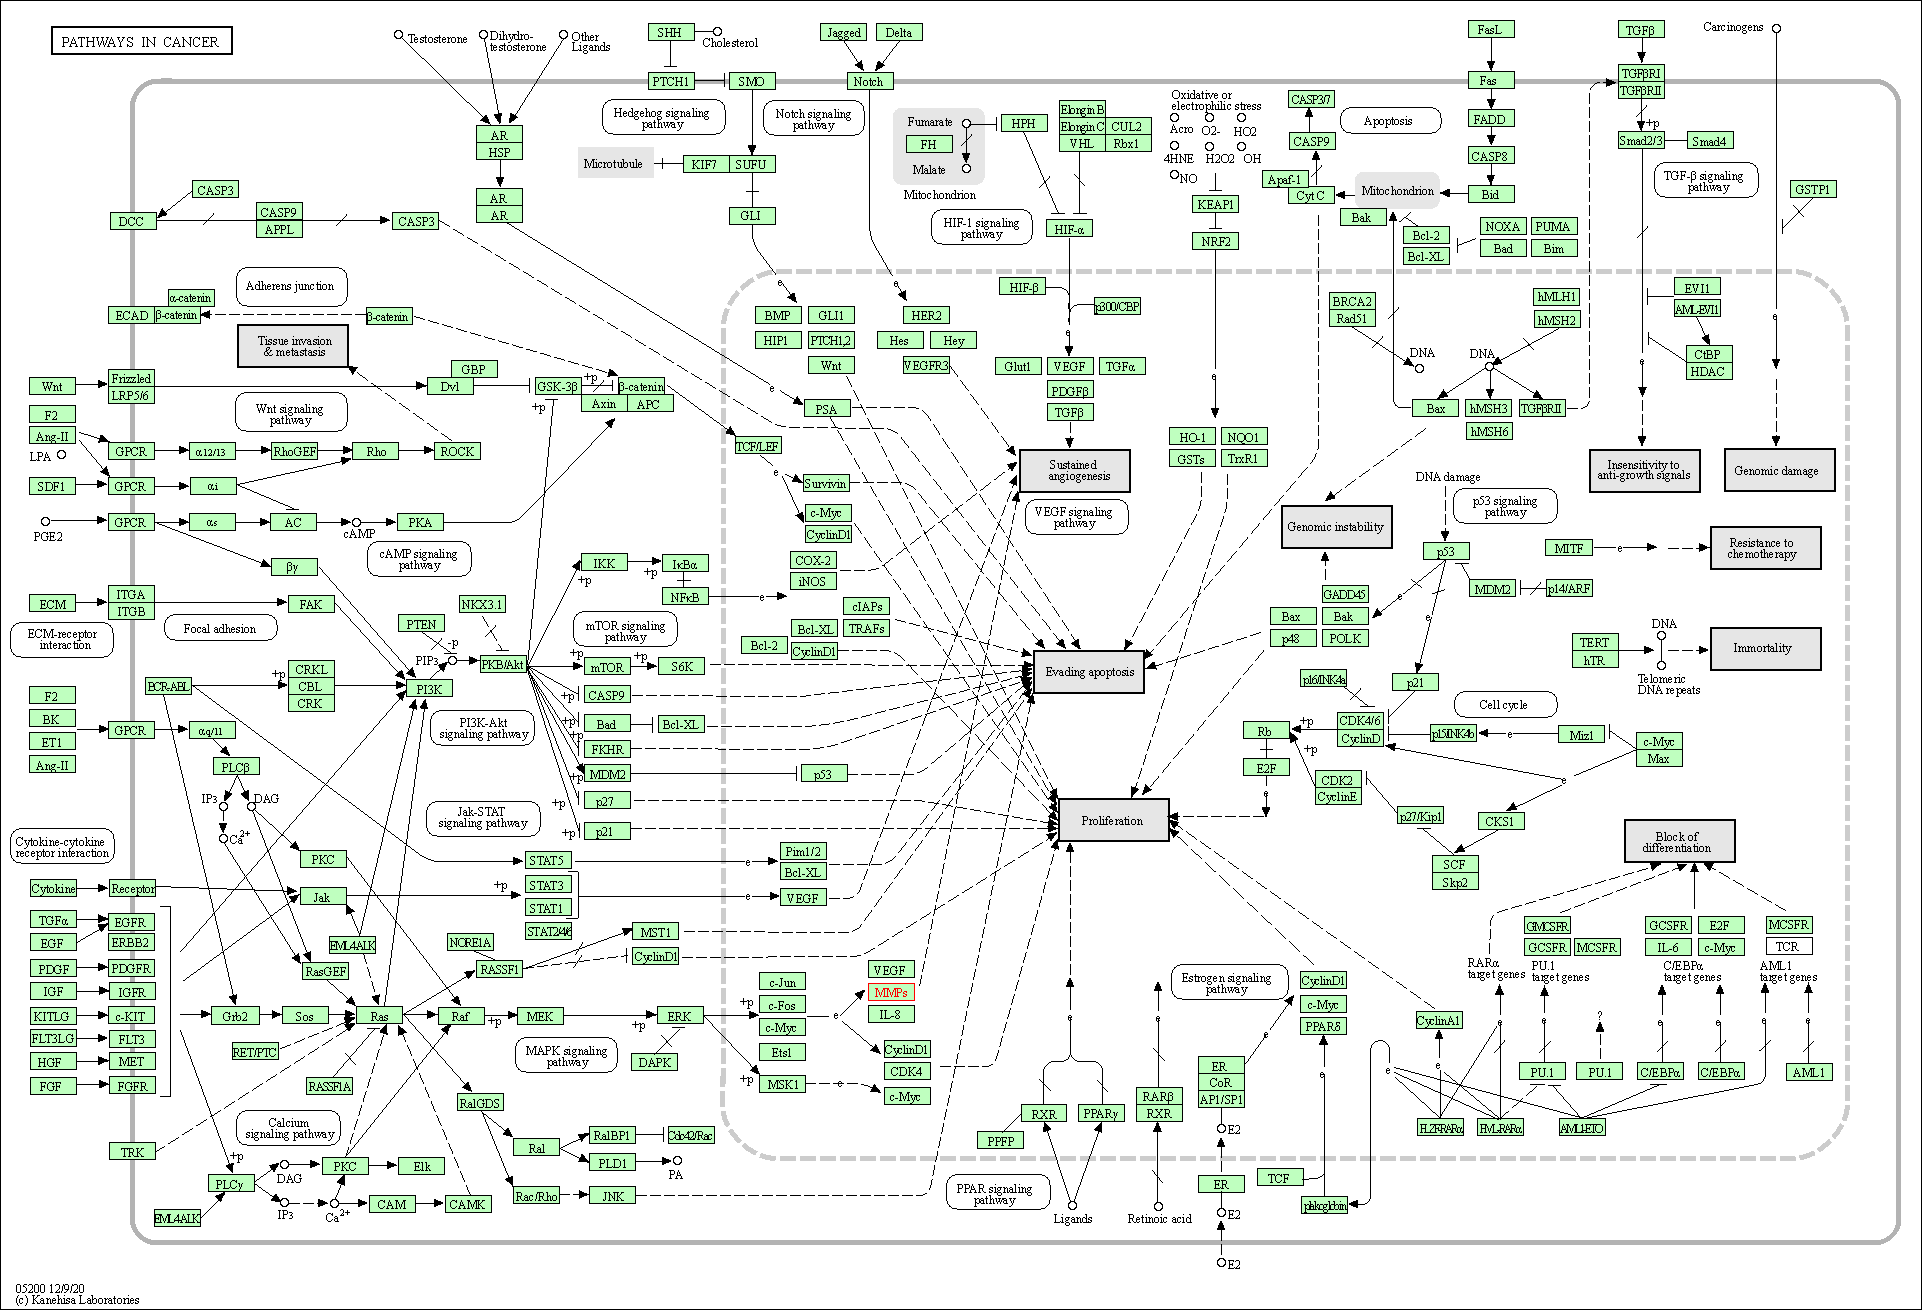
| KEGG Pathway | MAPK signaling pathway | Click to Show/Hide | ||
| 2 | NF-kappa B signaling pathway | |||
| 3 | Osteoclast differentiation | |||
| 4 | Legionellosis | |||
| 5 | HTLV-I infection | |||
| 6 | Epstein-Barr virus infection | |||
| 7 | Pathways in cancer | |||
| 8 | Viral carcinogenesis | |||
| NetPath Pathway | IL5 Signaling Pathway | Click to Show/Hide | ||
| Panther Pathway | Apoptosis signaling pathway | Click to Show/Hide | ||
| 2 | B cell activation | |||
| 3 | Inflammation mediated by chemokine and cytokine signaling pathway | |||
| 4 | T cell activation | |||
| 5 | Toll receptor signaling pathway | |||
| Pathwhiz Pathway | Intracellular Signalling Through Adenosine Receptor A2a and Adenosine | Click to Show/Hide | ||
| 2 | Intracellular Signalling Through Adenosine Receptor A2b and Adenosine | |||
| Pathway Interaction Database | IL12-mediated signaling events | Click to Show/Hide | ||
| 2 | Alternative NF-kappaB pathway | |||
| Reactome | RIP-mediated NFkB activation via ZBP1 | Click to Show/Hide | ||
| 2 | DEx/H-box helicases activate type I IFN and inflammatory cytokines production | |||
| 3 | TAK1 activates NFkB by phosphorylation and activation of IKKs complex | |||
| 4 | Interleukin-1 processing | |||
| 5 | IKBKG deficiency causes anhidrotic ectodermal dysplasia with immunodeficiency (EDA-ID) (via TLR) | |||
| 6 | IkBA variant leads to EDA-ID | |||
| 7 | Dectin-1 mediated noncanonical NF-kB signaling | |||
| 8 | NIK-->noncanonical NF-kB signaling | |||
| 9 | TRAF6 mediated NF-kB activation | |||
| WikiPathways | Toll-like receptor signaling pathway | Click to Show/Hide | ||
| 2 | DNA Damage Response (only ATM dependent) | |||
| 3 | SIDS Susceptibility Pathways | |||
| 4 | Nuclear Receptors Meta-Pathway | |||
| 5 | Cytosolic sensors of pathogen-associated DNA | |||
| 6 | TAK1 activates NFkB by phosphorylation and activation of IKKs complex | |||
| 7 | EBV LMP1 signaling | |||
| 8 | TNF alpha Signaling Pathway | |||
| 9 | TSLP Signaling Pathway | |||
| 10 | Neural Crest Differentiation | |||
| 11 | TWEAK Signaling Pathway | |||
| 12 | RANKL/RANK Signaling Pathway | |||
| 13 | RIG-I/MDA5 mediated induction of IFN-alpha/beta pathways | |||
| 14 | Interleukin-1 processing | |||
| 15 | Folate Metabolism | |||
| 16 | Vitamin B12 Metabolism | |||
| 17 | Selenium Micronutrient Network | |||
| 18 | Regulation of toll-like receptor signaling pathway | |||