Drug Details
| General Information of the Drug (ID: DR8244) | ||||
|---|---|---|---|---|
| Name |
Imatinib
|
|||
| Synonyms |
Imatinib-d8; Imatinib D8; [d8]-Imatinib; 1092942-82-9; DTXSID70649425; J-002260
Click to Show/Hide
|
|||
| Molecular Type |
Small molecule
|
|||
| Disease | Mantle cell lymphoma [ICD-11: 2A85] | Approved | [1] | |
| Structure |

|
Click to Download Mol2D MOL |
||
| ADMET Property |
BDDCS Class
Biopharmaceutics Drug Disposition Classification System (BDDCS) Class 2: low solubility and high permeability
Bioavailability
98% of drug becomes completely available to its intended biological destination(s)
Clearance
The drug present in the plasma can be removed from the body at the rate of 3.3 mL/min/kg
Elimination
5% of drug is excreted from urine in the unchanged form
Half-life
The concentration or amount of drug in body reduced by one-half in 18 hours (imatinib), and 40 hours (its major active metabolite the N - demethyl derivative)
Half-life
The concentration or amount of drug in body reduced by one-half in 22 hours
Metabolism
The drug is metabolized via the hepatic
MRTD
The Maximum Recommended Therapeutic Dose (MRTD) of drug that ensured maximising efficacy and moderate side effect is 20.25863 micromolar/kg/day
Unbound Fraction
The unbound fraction of drug in plasma is 0.05%
Vd
Fluid volume that would be required to contain the amount of drug present in the body at the same concentration as in the plasma 3.9 L/kg
Water Solubility
The ability of drug to dissolve in water is measured as 1 mg/mL
Click to Show/Hide
|
|||
| Click to Show/Hide the Molecular Information and External Link(s) of This Natural Product | ||||
| Formula |
C29H31N7O
|
|||
| PubChem CID | ||||
| Canonical SMILES |
CC1=C(C=C(C=C1)NC(=O)C2=CC=C(C=C2)CN3CCN(CC3)C)NC4=NC=CC(=N4)C5=CN=CC=C5
|
|||
| InChI |
1S/C29H31N7O/c1-21-5-10-25(18-27(21)34-29-31-13-11-26(33-29)24-4-3-12-30-19-24)32-28(37)23-8-6-22(7-9-23)20-36-16-14-35(2)15-17-36/h3-13,18-19H,14-17,20H2,1-2H3,(H,32,37)(H,31,33,34)
|
|||
| InChIKey |
KTUFNOKKBVMGRW-UHFFFAOYSA-N
|
|||
| CAS Number |
CAS 152459-95-5
|
|||
| GDSC | ||||
| TTD Drug ID | ||||
| Combinatorial Therapeutic Effect(s) Validated Clinically or Experimentally | ||||||
|---|---|---|---|---|---|---|
| α. A List of Natural Product(s) Able to Enhance the Efficacy of This Drug | ||||||
| Apicidin | Fusarium sp. | Click to Show/Hide the Molecular Data of This NP | ||||
| Achieving Therapeutic Synergy | Click to Show/Hide | |||||
| Representative Experiment Reporting the Effect of This Combination | [2] | |||||
| Detail(s) |
Combination Info
|
|||||
| Molecule(s)
Regulation |
Down-regulation | Expression | ABL | Molecule Info |
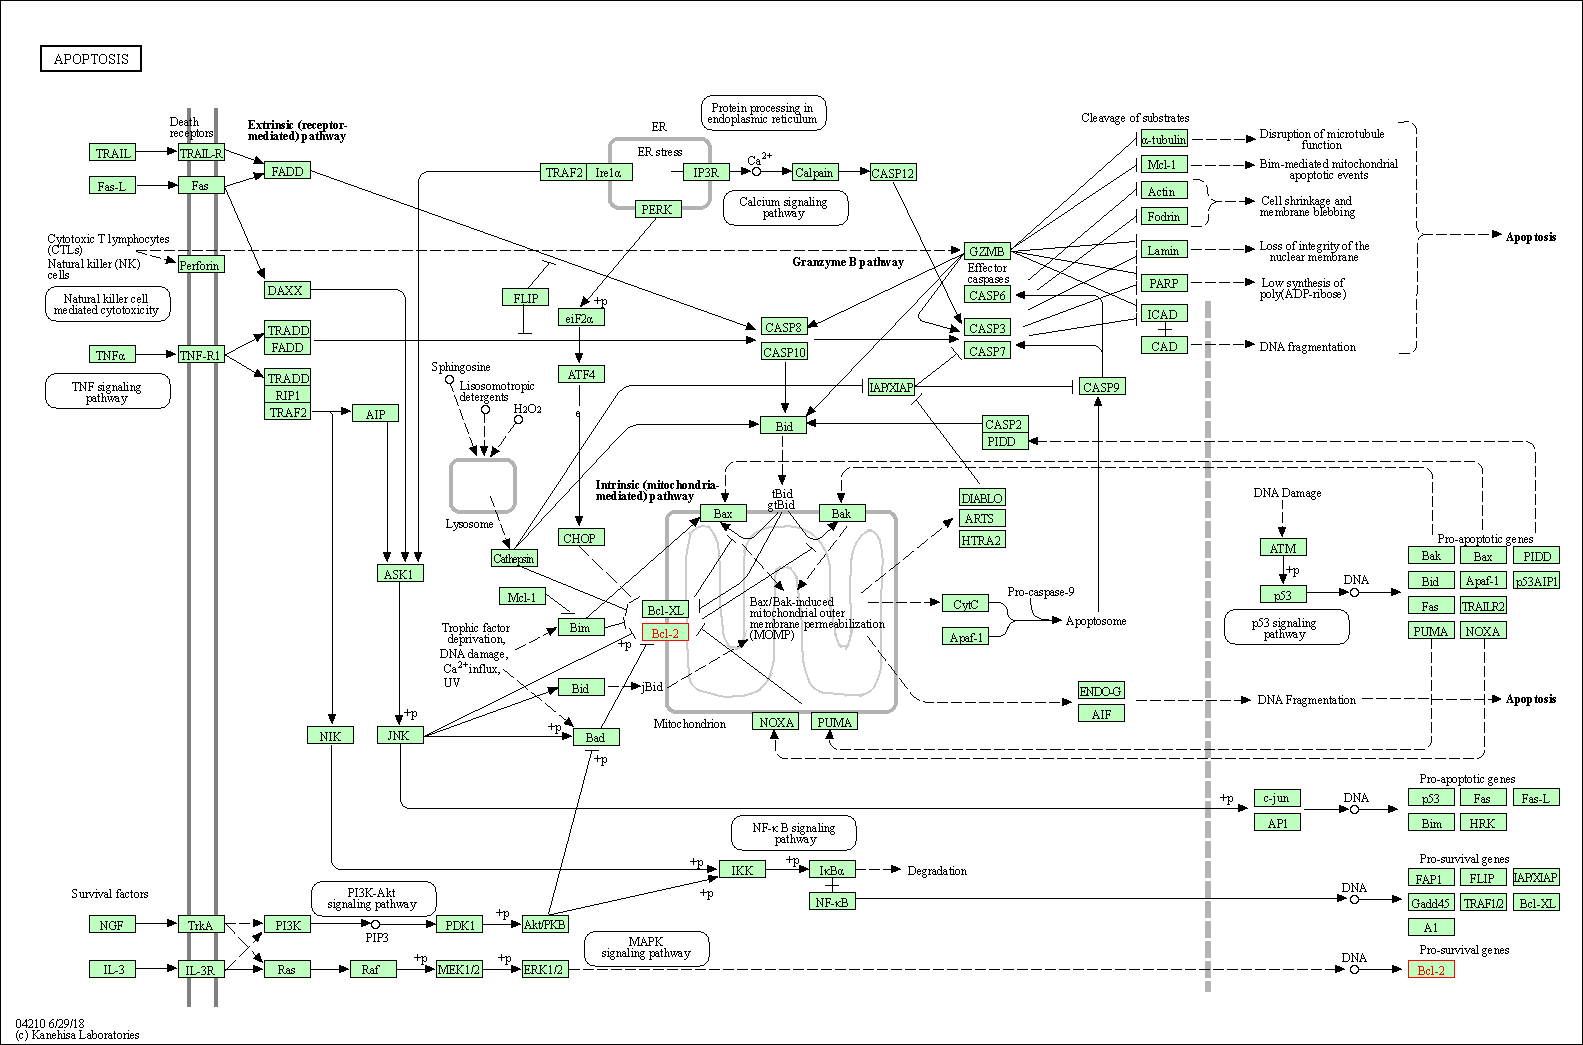
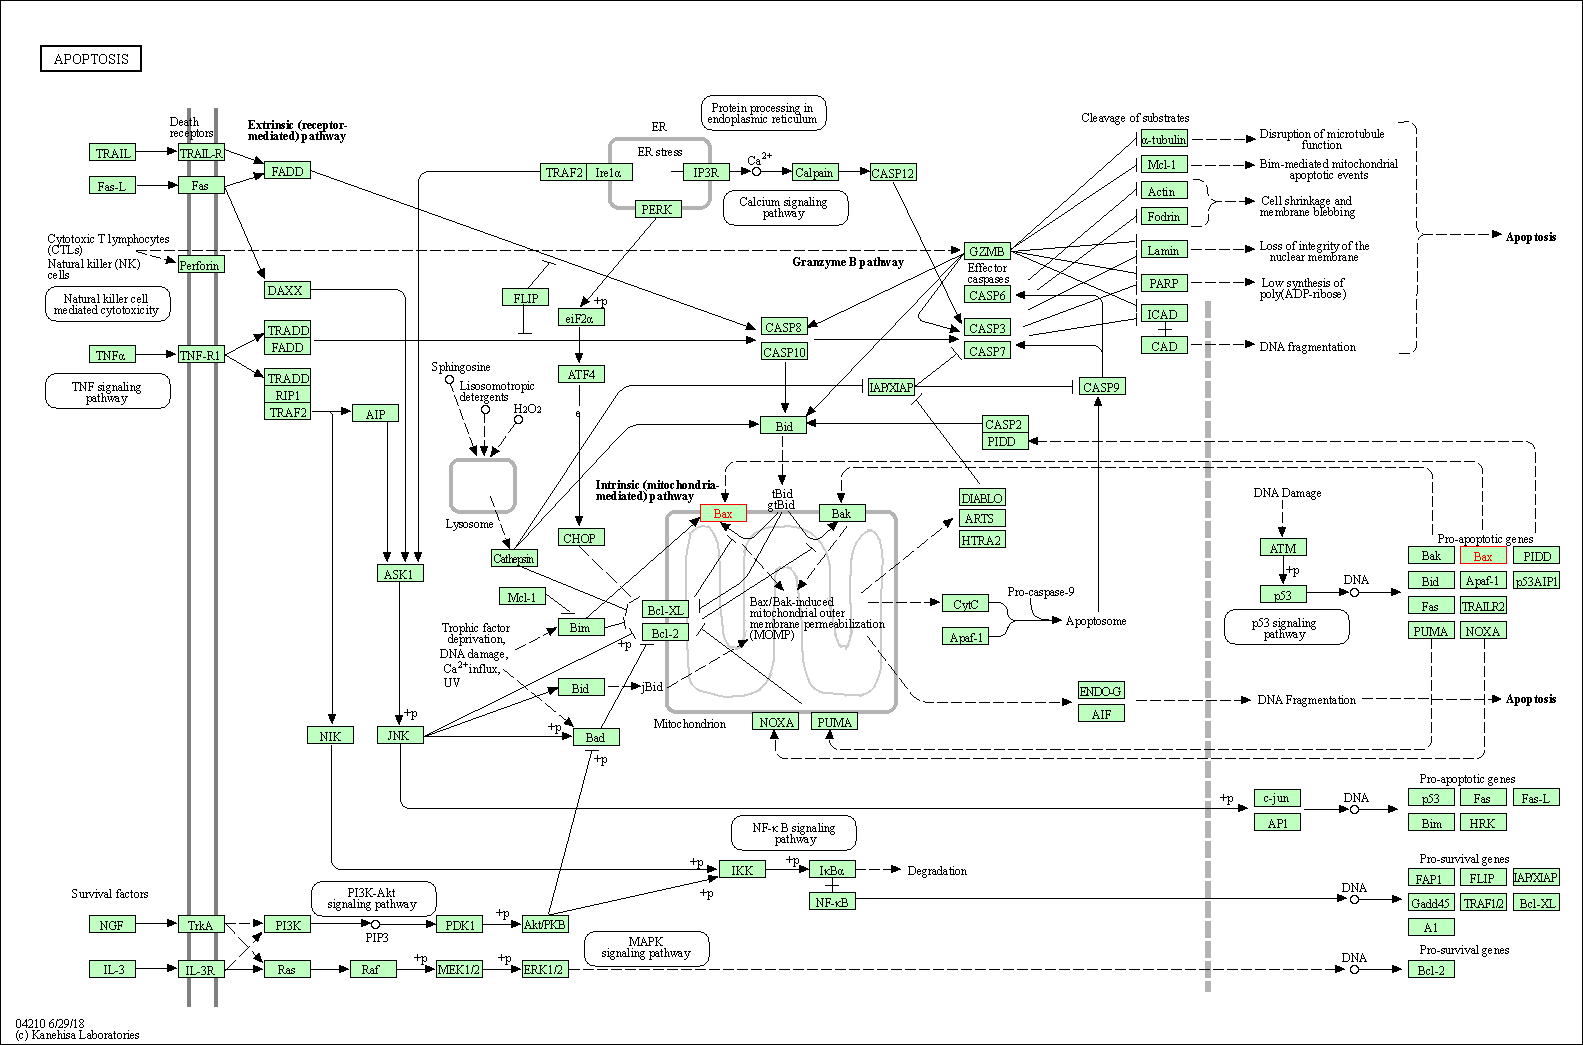
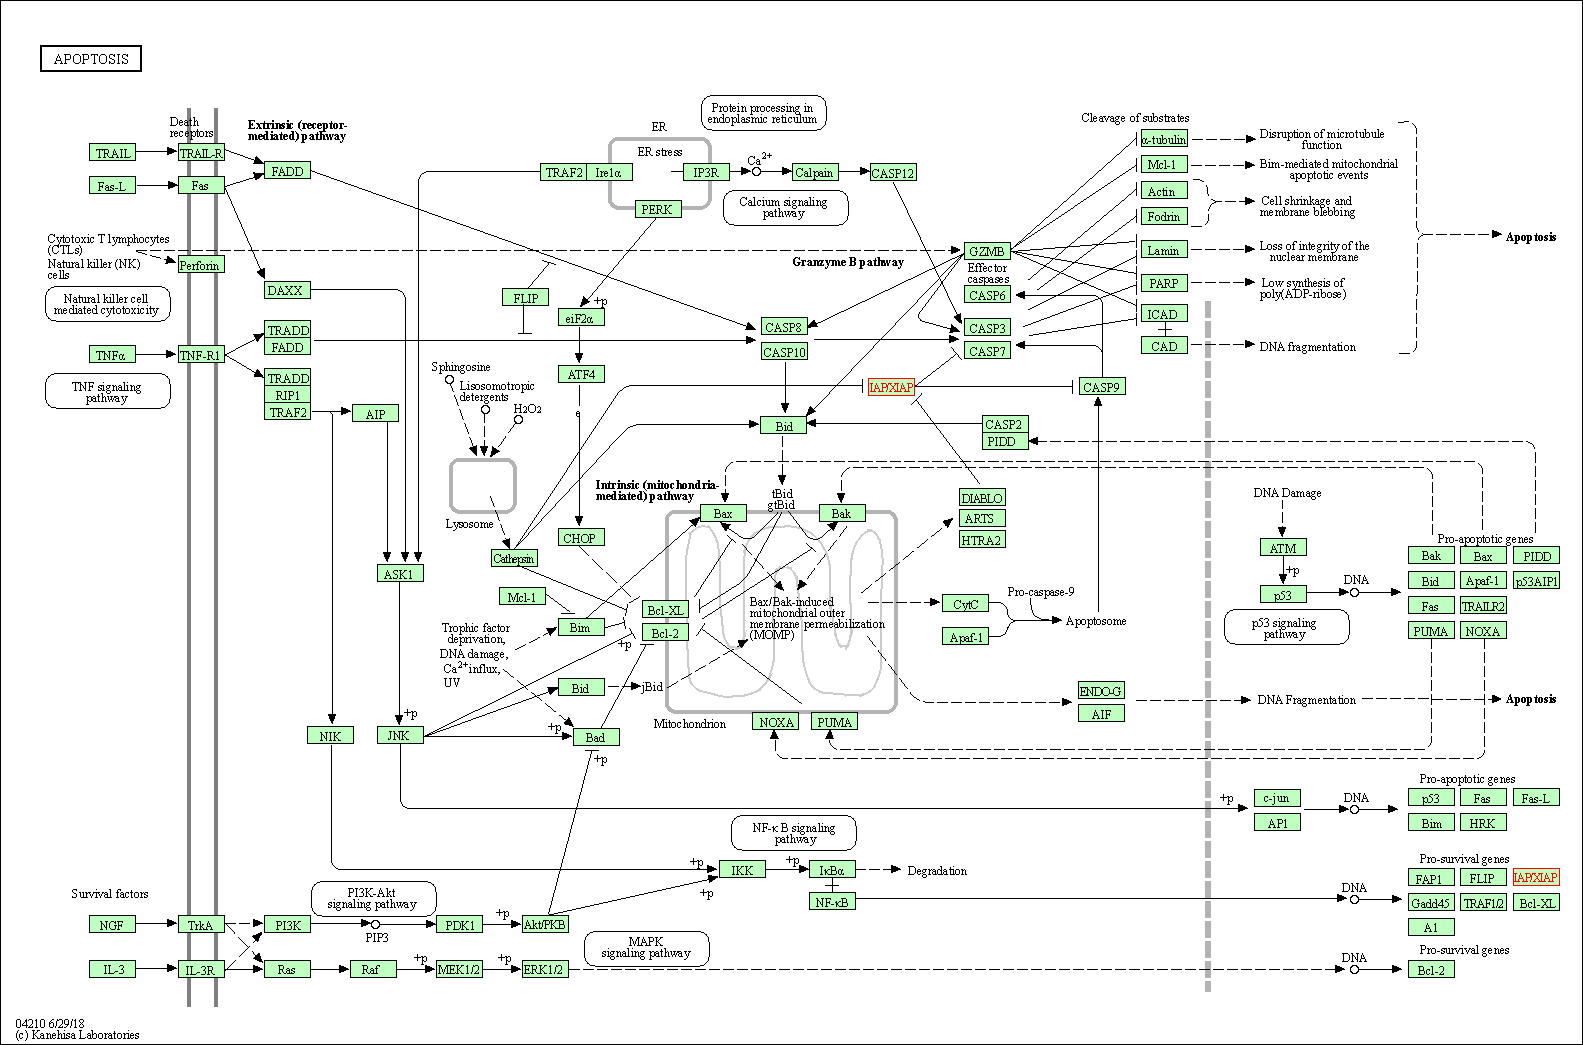
Pathway MAP
|
|
| In-vitro Model | K-562 | CVCL_0004 | Chronic myelogenous leukemia | Homo sapiens | ||
| Experimental
Result(s) |
Apicidin potentiates the imatinib-induced apoptosis of Bcr-Abl-positive human leukaemia cells by enhancing the activation of mitochondria-dependent caspase cascades. | |||||
| Arsenic trioxide | Realgar and orpiment | Click to Show/Hide the Molecular Data of This NP | ||||
| Achieving Therapeutic Synergy | Click to Show/Hide | |||||
| Representative Experiment Reporting the Effect of This Combination | [3] | |||||
| Detail(s) |
Combination Info
|
|||||
| Molecule(s)
Regulation |
Down-regulation | Expression | ABL | Molecule Info |
Pathway MAP
|
|
| Down-regulation | Expression | BCR | Molecule Info |
Pathway MAP
|
||
| Up-regulation | Cleavage | CASP3 | Molecule Info |
Pathway MAP
|
||
| In-vitro Model | K-562 | CVCL_0004 | Chronic myelogenous leukemia | Homo sapiens | ||
| Experimental
Result(s) |
As2O3 in combination with imatinib showed favorable cytotoxicity and proapoptotic activity in chronic myelogenous leckemia. | |||||
| Costunolide | Magnolia sieboldii | Click to Show/Hide the Molecular Data of This NP | ||||
| Achieving Therapeutic Synergy | Click to Show/Hide | |||||
| Representative Experiment Reporting the Effect of This Combination | [4] | |||||
| Detail(s) |
Combination Info
|
|||||
| Molecule(s)
Regulation |
Up-regulation | Cleavage | CASP3 | Molecule Info |
Pathway MAP
|
|
| In-vitro Model | K-562 | CVCL_0004 | Chronic myelogenous leukemia | Homo sapiens | ||
| Experimental
Result(s) |
Costunolide promotes imatinib-induced apoptosis in chronic myeloid leukemia cells via the Bcr/Abl-Stat5 pathway. | |||||
| Curcumin | Hellenia speciosa | Click to Show/Hide the Molecular Data of This NP | ||||
| Achieving Therapeutic Synergy | Click to Show/Hide | |||||
| Representative Experiment Reporting the Effect of This Combination | [5] | |||||
| Detail(s) |
Combination Info
|
|||||
| Molecule(s)
Regulation |
Down-regulation | Expression | ABL | Molecule Info |
Pathway MAP
|
|
| Down-regulation | Expression | BCR | Molecule Info |
Pathway MAP
|
||
| In-vitro Model | SUP-B15 | CVCL_0103 | B acute lymphoblastic leukemia | Homo sapiens | ||
| THP-1 | CVCL_0006 | Childhood acute monocytic leukemia | Homo sapiens | |||
| ARAC-8C | CVCL_GZ09 | T acute lymphoblastic leukemia | Homo sapiens | |||
| In-vivo Model | Female BALB/c null mice were injected with 107 SUP-B15 cells via tail vein. | |||||
| Experimental
Result(s) |
Curcumin potentiates the anti-leukemia effects of imatinib by downregulation of the AKT/mTOR pathway and BCR/ABL gene expression in Ph+ acute lymphoblastic leukemia. | |||||
| Daunorubicin | Streptomyces peucetius | Click to Show/Hide the Molecular Data of This NP | ||||
| Achieving Therapeutic Synergy | Click to Show/Hide | |||||
| Representative Experiment Reporting the Effect of This Combination | [6] | |||||
| Detail(s) |
Combination Info
|
|||||
| Experimental
Result(s) |
The combination of IM with a standard "3+7" regiment was well tolerated and provided a high response rate. | |||||
| Flavopiridol | Dysoxylum binectariferum | Click to Show/Hide the Molecular Data of This NP | ||||
| Augmenting Drug Sensitivity | Click to Show/Hide | |||||
| Representative Experiment Reporting the Effect of This Combination | [7] | |||||
| Detail(s) |
Combination Info
|
|||||
| Molecule(s)
Regulation |
Up-regulation | Cleavage | CASP8 | Molecule Info |
Pathway MAP
|
|
| Up-regulation | Cleavage | CASP9 | Molecule Info |
Pathway MAP
|
||
| Up-regulation | Expression | DIABLO | Molecule Info |
Pathway MAP
|
||
| Up-regulation | Cleavage | PARP1 | Molecule Info |
Pathway MAP
|
||
| Biological
Regulation |
Up-regulation | Cytochrome c release | ||||
| In-vitro Model | K-562 | CVCL_0004 | Chronic myelogenous leukemia | Homo sapiens | ||
| U-937 | CVCL_0007 | Adult acute monocytic leukemia | Homo sapiens | |||
| HL-60 | CVCL_0002 | Adult acute myeloid leukemia | Homo sapiens | |||
| Jurkat | CVCL_0065 | T acute lymphoblastic leukemia | Homo sapiens | |||
| LAMA-84 | CVCL_0388 | Chronic myelogenous leukemia | Homo sapiens | |||
| Experimental
Result(s) |
Flavopiridol potentiates STI571-induced mitochondrial damage and apoptosis in BCR-ABL-positive human leukemia cells. | |||||
| Galangin | Plantago major | Click to Show/Hide the Molecular Data of This NP | ||||
| Augmenting Drug Sensitivity | Click to Show/Hide | |||||
| Representative Experiment Reporting the Effect of This Combination | [8] | |||||
| Detail(s) |
Combination Info
|
|||||
| Molecule(s)
Regulation |
Down-regulation | Expression | BCL-2 | Molecule Info |
Pathway MAP
|
|
| In-vitro Model | K-562 | CVCL_0004 | Chronic myelogenous leukemia | Homo sapiens | ||
| KCL-22 | CVCL_2091 | Chronic myelogenous leukemia | Homo sapiens | |||
| Experimental
Result(s) |
Galangin caused a decrease in Bcl-2 levels and markedly increased the apoptotic activity of imatinib both in sensitive or imatinib-resistant Bcr-Abl+ cell lines. | |||||
| Gossypol | Gossypium herbaceum | Click to Show/Hide the Molecular Data of This NP | ||||
| Achieving Therapeutic Synergy | Click to Show/Hide | |||||
| Representative Experiment Reporting the Effect of This Combination | [9] | |||||
| Detail(s) |
Combination Info
|
|||||
| Molecule(s)
Regulation |
Down-regulation | Expression | BCL-2 | Molecule Info |
Pathway MAP
|
|
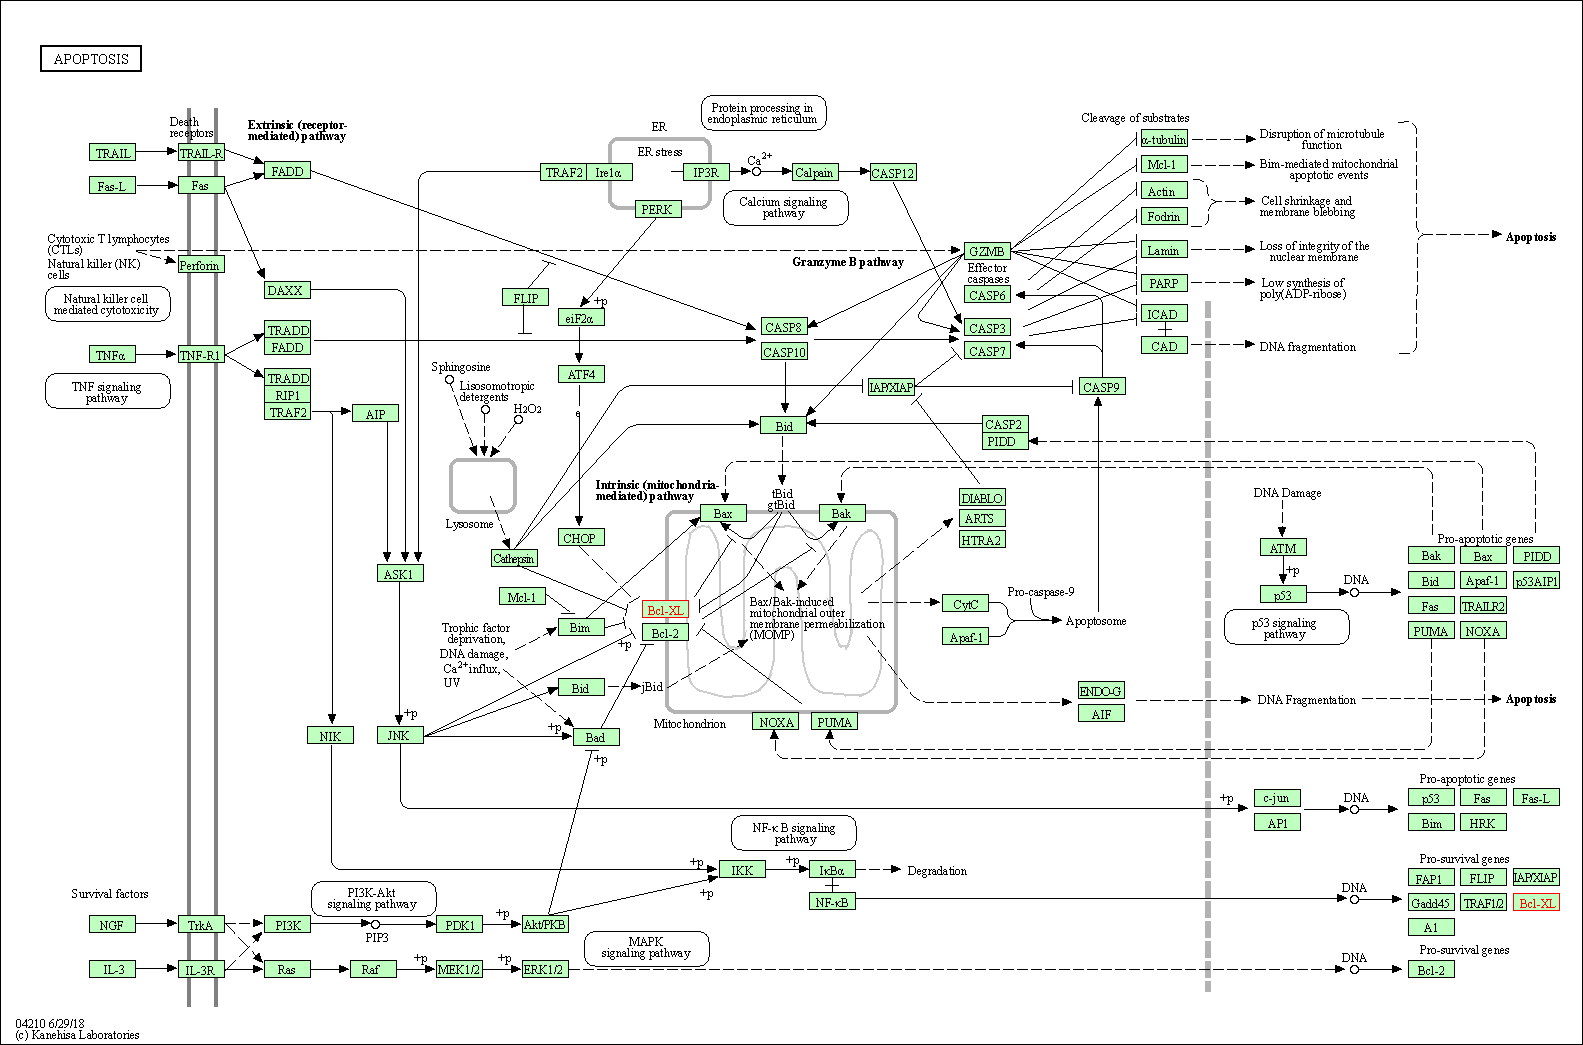
| Down-regulation | Expression | BCL-xL | Molecule Info |
Pathway MAP
|
||
| Up-regulation | Cleavage | CASP3 | Molecule Info |
Pathway MAP
|
||
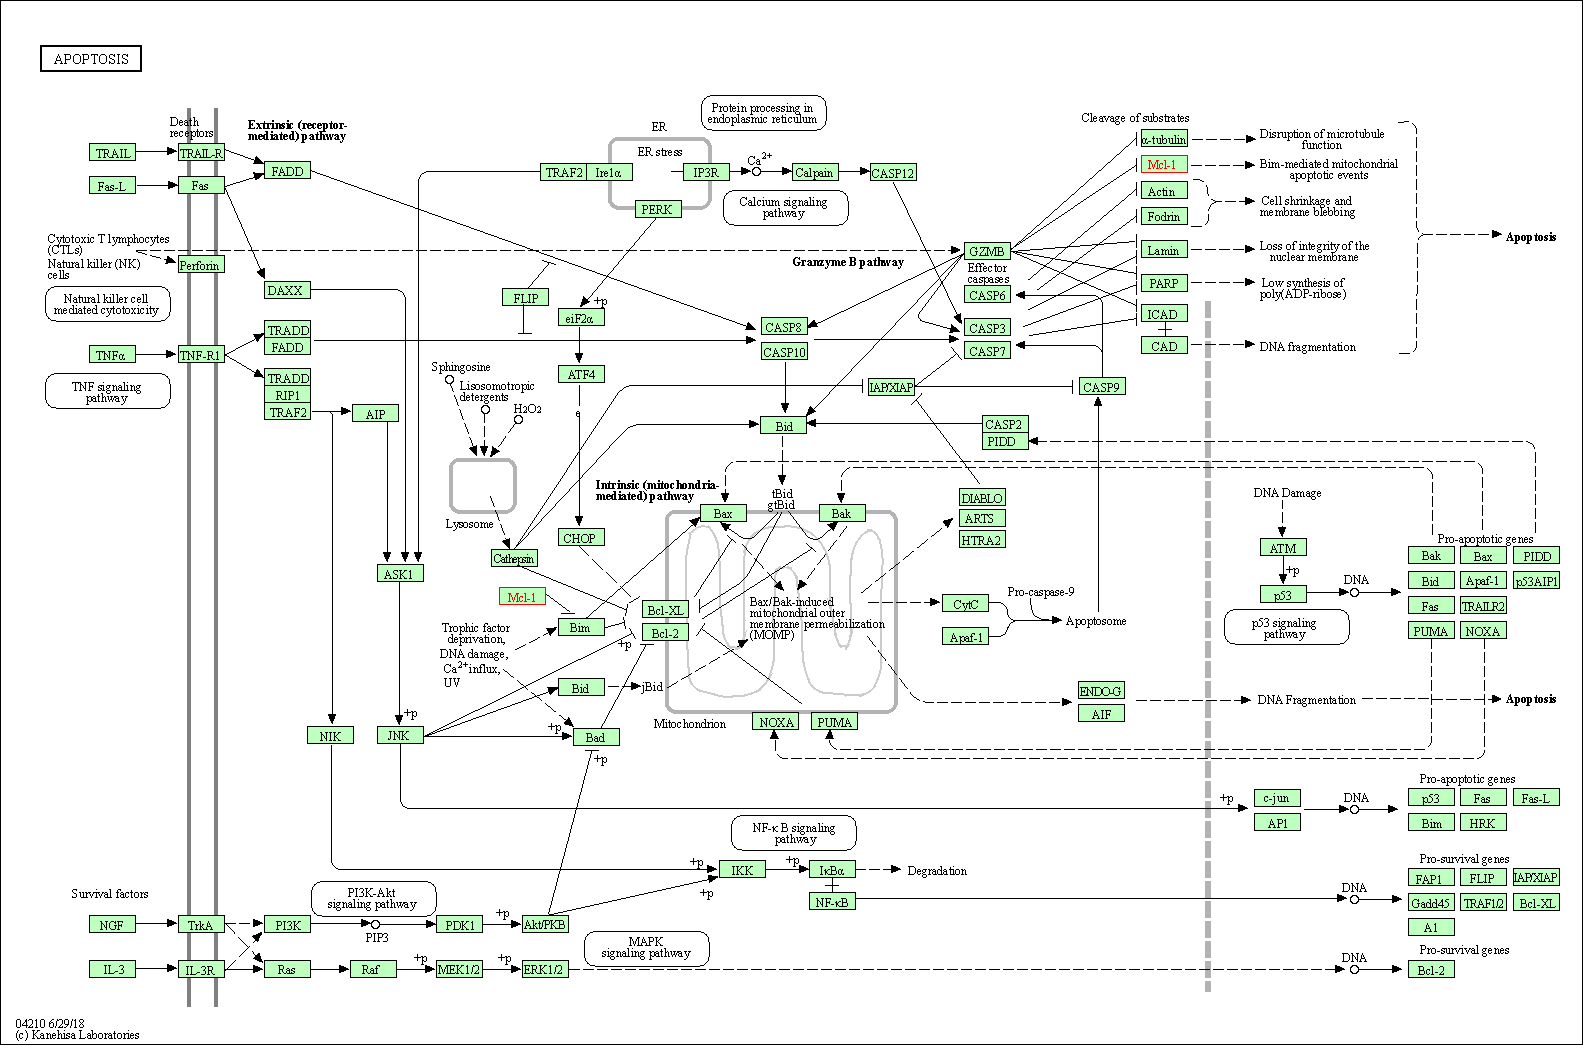
| Down-regulation | Expression | MCL1 | Molecule Info |
Pathway MAP
|
||
| Biological
Regulation |
Up-regulation | Cytochrome c release | ||||
| In-vitro Model | K-562 | CVCL_0004 | Chronic myelogenous leukemia | Homo sapiens | ||
| Experimental
Result(s) |
Gossypol and its combination with imatinib induce apoptosis in human chronic myeloid leukemic cells. | |||||
| Honokiol | Magnolia officinalis | Click to Show/Hide the Molecular Data of This NP | ||||
| Achieving Therapeutic Synergy | Click to Show/Hide | |||||
| Representative Experiment Reporting the Effect of This Combination | [10] | |||||
| Detail(s) |
Combination Info
|
|||||
| In-vitro Model | NB4 | CVCL_0005 | Acute promyelocytic leukemia | Homo sapiens | ||
| K-562 | CVCL_0004 | Chronic myelogenous leukemia | Homo sapiens | |||
| Experimental
Result(s) |
Honokiol induces paraptosis and apoptosis and exhibits schedule-dependent synergy in combination with imatinib in human leukemia cells. | |||||
| Luteolin | Abrus precatorius | Click to Show/Hide the Molecular Data of This NP | ||||
| Augmenting Drug Sensitivity | Click to Show/Hide | |||||
| Representative Experiment Reporting the Effect of This Combination | [11] | |||||
| Detail(s) |
Combination Info
|
|||||
| In-vitro Model | K-562 | CVCL_0004 | Chronic myelogenous leukemia | Homo sapiens | ||
| Experimental
Result(s) |
Combination treatment may provide better outcomes in terms of cytotoxicity and thus reduce the dosages of imatinib used. | |||||
| Neferine | Nelumbo nucifera | Click to Show/Hide the Molecular Data of This NP | ||||
| Achieving Therapeutic Synergy | Click to Show/Hide | |||||
| Representative Experiment Reporting the Effect of This Combination | [12] | |||||
| Detail(s) |
Combination Info
|
|||||
| Molecule(s)
Regulation |
Down-regulation | Phosphorylation | ERK1 | Molecule Info |
Pathway MAP
|
|
| Down-regulation | Phosphorylation | MCL1 | Molecule Info |
Pathway MAP
|
||
| In-vitro Model | Bone marrow mononuclear cells derived from chronic myeloid leukemia patients | Chronic myeloid leukemia | Homo sapiens | |||
| Experimental
Result(s) |
These results suggest that neferine might be a potential imatinib sensitizer in CML treatment. | |||||
| Oridonin | Isodon rubescens | Click to Show/Hide the Molecular Data of This NP | ||||
| Achieving Therapeutic Synergy | Click to Show/Hide | |||||
| Representative Experiment Reporting the Effect of This Combination | [13] | |||||
| Detail(s) |
Combination Info
|
|||||
| Molecule(s)
Regulation |
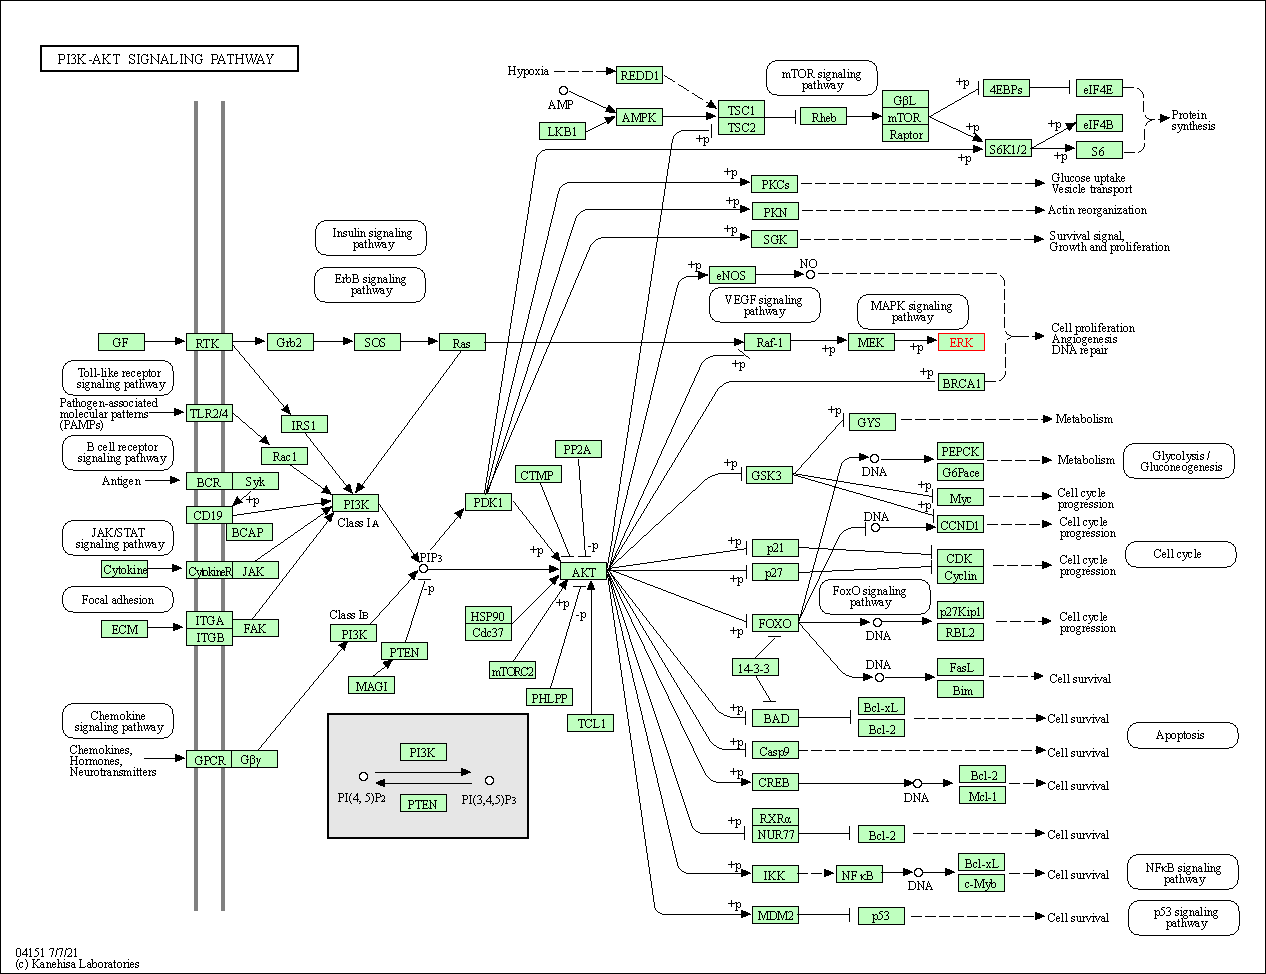
Down-regulation | Expression | AKT1 | Molecule Info |
Pathway MAP
|
|
| Up-regulation | Expression | BAX | Molecule Info |
Pathway MAP
|
||
| Up-regulation | Expression | BCL-2 | Molecule Info |
Pathway MAP
|
||
| Down-regulation | Expression | c-RAF | Molecule Info |
Pathway MAP
|
||
| Down-regulation | Expression | JTK8 | Molecule Info |
Pathway MAP
|
||
| Down-regulation | Expression | MEK1 | Molecule Info |
Pathway MAP
|
||
| Down-regulation | Expression | mTOR | Molecule Info |
Pathway MAP
|
||
| Down-regulation | Expression | STAT5B | Molecule Info |
Pathway MAP
|
||
| In-vitro Model | SUP-B15 | CVCL_0103 | B acute lymphoblastic leukemia | Homo sapiens | ||
| Experimental
Result(s) |
Oridonin in combination with imatinib exerts synergetic anti-leukemia effect in Ph+ acute lymphoblastic leukemia cells in vitro by inhibiting activation of LYN/mTOR signaling pathway. | |||||
| Resveratrol | Gnetum parvifolium | Click to Show/Hide the Molecular Data of This NP | ||||
| Achieving Therapeutic Synergy | Click to Show/Hide | |||||
| Representative Experiment Reporting the Effect of This Combination | [14] | |||||
| Detail(s) |
Combination Info
|
|||||
| In-vitro Model | K-562 | CVCL_0004 | Chronic myelogenous leukemia | Homo sapiens | ||
| Experimental
Result(s) |
Treatment with resveratrol (concentration-dependent) and imatinib mesylate showed significantly greater inhibition of K562 cell growth and a higher apoptosis rate of K562 cells than imatinib mesylate medication alone and the control group. | |||||
| Rottlerin | Mallotus philippinensis | Click to Show/Hide the Molecular Data of This NP | ||||
| Achieving Therapeutic Synergy | Click to Show/Hide | |||||
| Representative Experiment Reporting the Effect of This Combination | [15] | |||||
| Detail(s) |
Combination Info
|
|||||
| In-vitro Model | K-562 | CVCL_0004 | Chronic myelogenous leukemia | Homo sapiens | ||
| Experimental
Result(s) |
Rottlerin synergistically enhances imatinib-induced apoptosis of BCR/ABL-expressing cells through its mitochondrial uncoupling effect independent of protein kinase C-delta. | |||||
| Sulforaphane | Brassica oleracea | Click to Show/Hide the Molecular Data of This NP | ||||
| Achieving Therapeutic Synergy | Click to Show/Hide | |||||
| Representative Experiment Reporting the Effect of This Combination | [16] | |||||
| Detail(s) |
Combination Info
|
|||||
| Molecule(s)
Regulation |
Down-regulation | Expression | ABL | Molecule Info |
Pathway MAP
|
|
| Up-regulation | Expression | BAX | Molecule Info |
Pathway MAP
|
||
| Down-regulation | Expression | BCL-2 | Molecule Info |
Pathway MAP
|
||
| Up-regulation | Expression | CASP3 | Molecule Info |
Pathway MAP
|
||
| Down-regulation | Expression | CTNNB1 | Molecule Info |
Pathway MAP
|
||
| Down-regulation | Expression | GSTP1 | Molecule Info |
Pathway MAP
|
||
| Up-regulation | Expression | PARP1 | Molecule Info |
Pathway MAP
|
||
| In-vitro Model | Ku812 | CVCL_0379 | Chronic myelogenous leukemia | Homo sapiens | ||
| Experimental
Result(s) |
Sulforaphane potentiates the efficacy of imatinib against chronic leukemia cancer stem cells through enhanced abrogation of Wnt/Beta-catenin function. | |||||
| Thymoquinone | Nigella sativa | Click to Show/Hide the Molecular Data of This NP | ||||
| Achieving Therapeutic Synergy | Click to Show/Hide | |||||
| Representative Experiment Reporting the Effect of This Combination | [17] | |||||
| Detail(s) |
Combination Info
|
|||||
| Molecule(s)
Regulation |
Down-regulation | Expression | ABCB1 | Molecule Info |
Pathway MAP
|
|
| Down-regulation | Expression | ABCG2 | Molecule Info |
Pathway MAP
|
||
| Down-regulation | Expression | SLC22A1 | Molecule Info |
Pathway MAP
|
||
| In-vitro Model | HCT 116 | CVCL_0291 | Colon carcinoma | Homo sapiens | ||
| Experimental
Result(s) |
TQ potentiates IM efficacy on HCT116 cells via uptake/efflux genes modulation. | |||||
| β. A List of Natural Product(s) Able to Reverse the Resistance of This Drug | ||||||
| Betulinic Acid | Rubus alceifolius | Click to Show/Hide the Molecular Data of This NP | ||||
| Reversing Drug Resistance | Click to Show/Hide | |||||
| Representative Experiment Reporting the Effect of This Combination | [18] | |||||
| Detail(s) |
Combination Info
|
|||||
| Biological
Regulation |
Up-regulation | HDAC3 ubiquitination and degradation | ||||
| In-vitro Model | K-562 | CVCL_0004 | Chronic myelogenous leukemia | Homo sapiens | ||
| Experimental
Result(s) |
Betulinic acid restores imatinib sensitivity in BCR-ABL1 kinase-independent, imatinib-resistant chronic myeloid leukemia by increasing HDAC3 ubiquitination and degradation. | |||||
| Gambogic acid | Garcinia morella | Click to Show/Hide the Molecular Data of This NP | ||||
| Reversing Drug Resistance | Click to Show/Hide | |||||
| Representative Experiment Reporting the Effect of This Combination | [19] | |||||
| Detail(s) |
Combination Info
|
|||||
| Molecule(s)
Regulation |
Down-regulation | Phosphorylation | ABL | Molecule Info |
Pathway MAP
|
|
| Up-regulation | Expression | AIFM1 | Molecule Info |
Pathway MAP
|
||
| Down-regulation | Phosphorylation | AKT1 | Molecule Info |
Pathway MAP
|
||
| Down-regulation | Expression | BCL-2 | Molecule Info |
Pathway MAP
|
||
| Down-regulation | Phosphorylation | BCR | Molecule Info |
Pathway MAP
|
||
| Down-regulation | Phosphorylation | BRD4 | Molecule Info |
Pathway MAP
|
||
| Up-regulation | Cleavage | CASP3 | Molecule Info |
Pathway MAP
|
||
| Up-regulation | Cleavage | CASP8 | Molecule Info |
Pathway MAP
|
||
| Up-regulation | Cleavage | CASP9 | Molecule Info |
Pathway MAP
|
||
| Down-regulation | Phosphorylation | CRKL | Molecule Info |
Pathway MAP
|
||
| Down-regulation | Phosphorylation | ERK1 | Molecule Info |
Pathway MAP
|
||
| Down-regulation | Phosphorylation | ERK2 | Molecule Info |
Pathway MAP
|
||
| Down-regulation | Expression | MCL1 | Molecule Info |
Pathway MAP
|
||
| Down-regulation | Phosphorylation | STAT5B | Molecule Info |
Pathway MAP
|
||
| Down-regulation | Expression | XIAP | Molecule Info |
Pathway MAP
|
||
| Biological
Regulation |
Up-regulation | Cytochrome c release | ||||
| In-vitro Model | KBM-5 | CVCL_0373 | Chronic myelogenous leukemia | Homo sapiens | ||
| K-562 | CVCL_0004 | Chronic myelogenous leukemia | Homo sapiens | |||
| KBM5-T315I | Chronic myeloid leukemia | Homo sapiens | ||||
| In-vivo Model | A total of 3 * 107 of KBM5 or KBM5-T315I cells were inoculated subcutaneously on the flanks of 5-week-old male nude mice. | |||||
| Experimental
Result(s) |
Gambogic acid induces apoptosis in imatinib-resistant chronic myeloid leukemia cells via inducing proteasome inhibition and caspase-dependent Bcr-Abl downregulation. | |||||
| Target and Pathway | ||||
|---|---|---|---|---|
| Target(s) | Fusion protein Bcr-Abl (Bcr-Abl) | Molecule Info | [20] | |
| Tyrosine-protein kinase Kit (KIT) | Molecule Info | [21] | ||
| Tyrosine-protein kinase SYK (SYK) | Molecule Info | [21] | ||
| KEGG Pathway | Ras signaling pathway | Click to Show/Hide | ||
| 2 | Rap1 signaling pathway | |||
| 3 | Cytokine-cytokine receptor interaction | |||
| 4 | Endocytosis | |||
| 5 | PI3K-Akt signaling pathway | |||
| 6 | Hematopoietic cell lineage | |||
| 7 | Melanogenesis | |||
| 8 | Pathways in cancer | |||
| 9 | Acute myeloid leukemia | |||
| 10 | Central carbon metabolism in cancer | |||
| 11 | NF-kappa B signaling pathway | |||
| 12 | Osteoclast differentiation | |||
| 13 | Platelet activation | |||
| 14 | Natural killer cell mediated cytotoxicity | |||
| 15 | B cell receptor signaling pathway | |||
| 16 | Fc epsilon RI signaling pathway | |||
| 17 | Fc gamma R-mediated phagocytosis | |||
| 18 | Tuberculosis | |||
| 19 | Epstein-Barr virus infection | |||
| 20 | Viral carcinogenesis | |||
| NetPath Pathway | IL3 Signaling Pathway | Click to Show/Hide | ||
| 2 | IL4 Signaling Pathway | |||
| 3 | KitReceptor Signaling Pathway | |||
| Panther Pathway | B cell activation | Click to Show/Hide | ||
| Pathwhiz Pathway | Fc Epsilon Receptor I Signaling in Mast Cells | Click to Show/Hide | ||
| Pathway Interaction Database | C-MYB transcription factor network | Click to Show/Hide | ||
| 2 | Signaling events mediated by Stem cell factor receptor (c-Kit) | |||
| 3 | Fc-epsilon receptor I signaling in mast cells | |||
| 4 | BCR signaling pathway | |||
| 5 | GMCSF-mediated signaling events | |||
| 6 | Atypical NF-kappaB pathway | |||
| 7 | Osteopontin-mediated events | |||
| 8 | FAS (CD95) signaling pathway | |||
| 9 | Thromboxane A2 receptor signaling | |||
| 10 | IL2-mediated signaling events | |||
| 11 | Class I PI3K signaling events | |||
| 12 | Alpha-synuclein signaling | |||
| Reactome | PIP3 activates AKT signaling | Click to Show/Hide | ||
| 2 | Regulation of KIT signaling | |||
| 3 | Constitutive Signaling by Aberrant PI3K in Cancer | |||
| 4 | RAF/MAP kinase cascade | |||
| 5 | GPVI-mediated activation cascade | |||
| 6 | FCGR activation | |||
| 7 | Regulation of actin dynamics for phagocytic cup formation | |||
| 8 | Role of phospholipids in phagocytosis | |||
| 9 | DAP12 signaling | |||
| 10 | Fc epsilon receptor (FCERI) signaling | |||
| 11 | Role of LAT2/NTAL/LAB on calcium mobilization | |||
| 12 | FCERI mediated MAPK activation | |||
| 13 | FCERI mediated Ca+2 mobilization | |||
| 14 | Integrin alphaIIb beta3 signaling | |||
| 15 | Interleukin-2 signaling | |||
| 16 | CLEC7A (Dectin-1) signaling | |||
| 17 | Dectin-2 family | |||
| 18 | Regulation of signaling by CBL | |||
| 19 | Antigen activates B Cell Receptor (BCR) leading to generation of second messengers | |||
| WikiPathways | Kit receptor signaling pathway | Click to Show/Hide | ||
| 2 | Differentiation Pathway | |||
| 3 | Signaling by SCF-KIT | |||
| 4 | PIP3 activates AKT signaling | |||
| 5 | Cardiac Progenitor Differentiation | |||
| 6 | miR-targeted genes in muscle cell - TarBase | |||
| 7 | miR-targeted genes in lymphocytes - TarBase | |||
| 8 | miR-targeted genes in epithelium - TarBase | |||
| 9 | IL-2 Signaling Pathway | |||
| 10 | IL-3 Signaling Pathway | |||
| 11 | Fc epsilon receptor (FCERI) signaling | |||
| 12 | Signaling by the B Cell Receptor (BCR) | |||
| 13 | Interleukin-2 signaling | |||
| 14 | Fcgamma receptor (FCGR) dependent phagocytosis | |||
| 15 | DAP12 interactions | |||
| 16 | B Cell Receptor Signaling Pathway | |||
| 17 | RANKL/RANK Signaling Pathway | |||
| 18 | Integrin alphaIIb beta3 signaling | |||
| 19 | GPVI-mediated activation cascade | |||
| 20 | Regulation of toll-like receptor signaling pathway | |||
| 21 | IL-5 Signaling Pathway | |||