Natural Product (NP) Details
| General Information of the NP (ID: NP8606) | |||||
|---|---|---|---|---|---|
| Name |
Fisetin
|
||||
| Synonyms |
2-(3,4-Dihydroxyphenyl)-3,7-dihydroxy-4H-chromen-4-one; 5-Desoxyquercetin; Fustel; Cotinin; Viset; 3,3',4',7-Tetrahydroxyflavone; Fisetholz; Superfustel; Fustet; Fietin; Junger fustik; 3,7,3',4'-Tetrahydroxyflavone; Ventin sumach; Zante fustic; Young fustic; Superfustel K; Ungarisches gelbholz; CI Natural Brown 1; Young fustic crystals; Bois bleu de Honqrie; BOIS bleude honqrie; CI 75620; NSC 407010; NSC 656275; 5-Deoxyquercetin; 2-(3,4-Dihydroxyphenyl)-3,7-dihydroxy-4H-1-benzopyran-4-one; Natural Brown 1; FISETIN
Click to Show/Hide
|
||||
| Species Origin | Toxicodendron succedaneum ... | Click to Show/Hide | |||
| Toxicodendron succedaneum | |||||
| Disease | Pancreatic cancer [ICD-11: 2C10] | Investigative | [1] | ||
| Structure |

|
Click to Download Mol2D MOL |
|||
| ADMET Property |
Absporption
Caco-2 Permeability
-5.759
MDCK Permeability
-4.871
PAMPA
+
HIA
-
Distribution
VDss
-0.743
PPB
95.3%
BBB
- - -
Metabolism
CYP1A2 inhibitor
+++
CYP1A2 substrate
- - -
CYP2C19 inhibitor
- - -
CYP2C19 substrate
- - -
CYP2C9 inhibitor
- -
CYP2C9 substrate
- - -
CYP2D6 inhibitor
- - -
CYP2D6 substrate
-
CYP3A4 inhibitor
+++
CYP3A4 substrate
- - -
CYP2B6 inhibitor
- - -
CYP2B6 substrate
- - -
CYP2C8 inhibitor
+++
HLM Stability
+++
Excretion
CLplasma
11.159
T1/2
1.732
Toxicity
DILI
++
Rat Oral Acute Toxicity
-
FDAMDD
++
Respiratory
+
Human Hepatotoxicity
-
Ototoxicity
- -
Drug-induced Nephrotoxicity
- - -
Drug-induced Neurotoxicity
- - -
Hematotoxicity
- - -
Genotoxicity
+++
Tips: 1. For the classification endpoints, the prediction probability values are transformed into six symbols: 0-0.1 (- - -), 0.1-0.3 (- -), 0.3-0.5 (-), 0.5-0.7 (+), 0.7-0.9 (++), and 0.9-1.0 (+++).
2. Additionally, the corresponding relationships of the three labels are as follows: excellent; medium; poor.
Click to Show/Hide
|
||||
| Click to Show/Hide the Molecular Information and External Link(s) of This Natural Product | |||||
| Formula |
C15H10O6
|
||||
| PubChem CID | |||||
| Canonical SMILES |
C1=CC(=C(C=C1C2=C(C(=O)C3=C(O2)C=C(C=C3)O)O)O)O
|
||||
| InChI |
1S/C15H10O6/c16-8-2-3-9-12(6-8)21-15(14(20)13(9)19)7-1-4-10(17)11(18)5-7/h1-6,16-18,20H
|
||||
| InChIKey |
XHEFDIBZLJXQHF-UHFFFAOYSA-N
|
||||
| CAS Number |
CAS 528-48-3
|
||||
| Herb ID | |||||
| ETMC ID | |||||
| SymMap ID | |||||
| TCMSP ID | |||||
| TTD Drug ID | |||||
| Combinatorial Therapeutic Effect(s) Validated Clinically or Experimentally | ||||||
|---|---|---|---|---|---|---|
| α. A List of Drug(s) Whose Efficacy can be Enhanced by This NP | ||||||
| Cisplatin | Bladder cancer | Click to Show/Hide the Molecular Data of This Drug | ||||
| Achieving Therapeutic Synergy | Click to Show/Hide | |||||
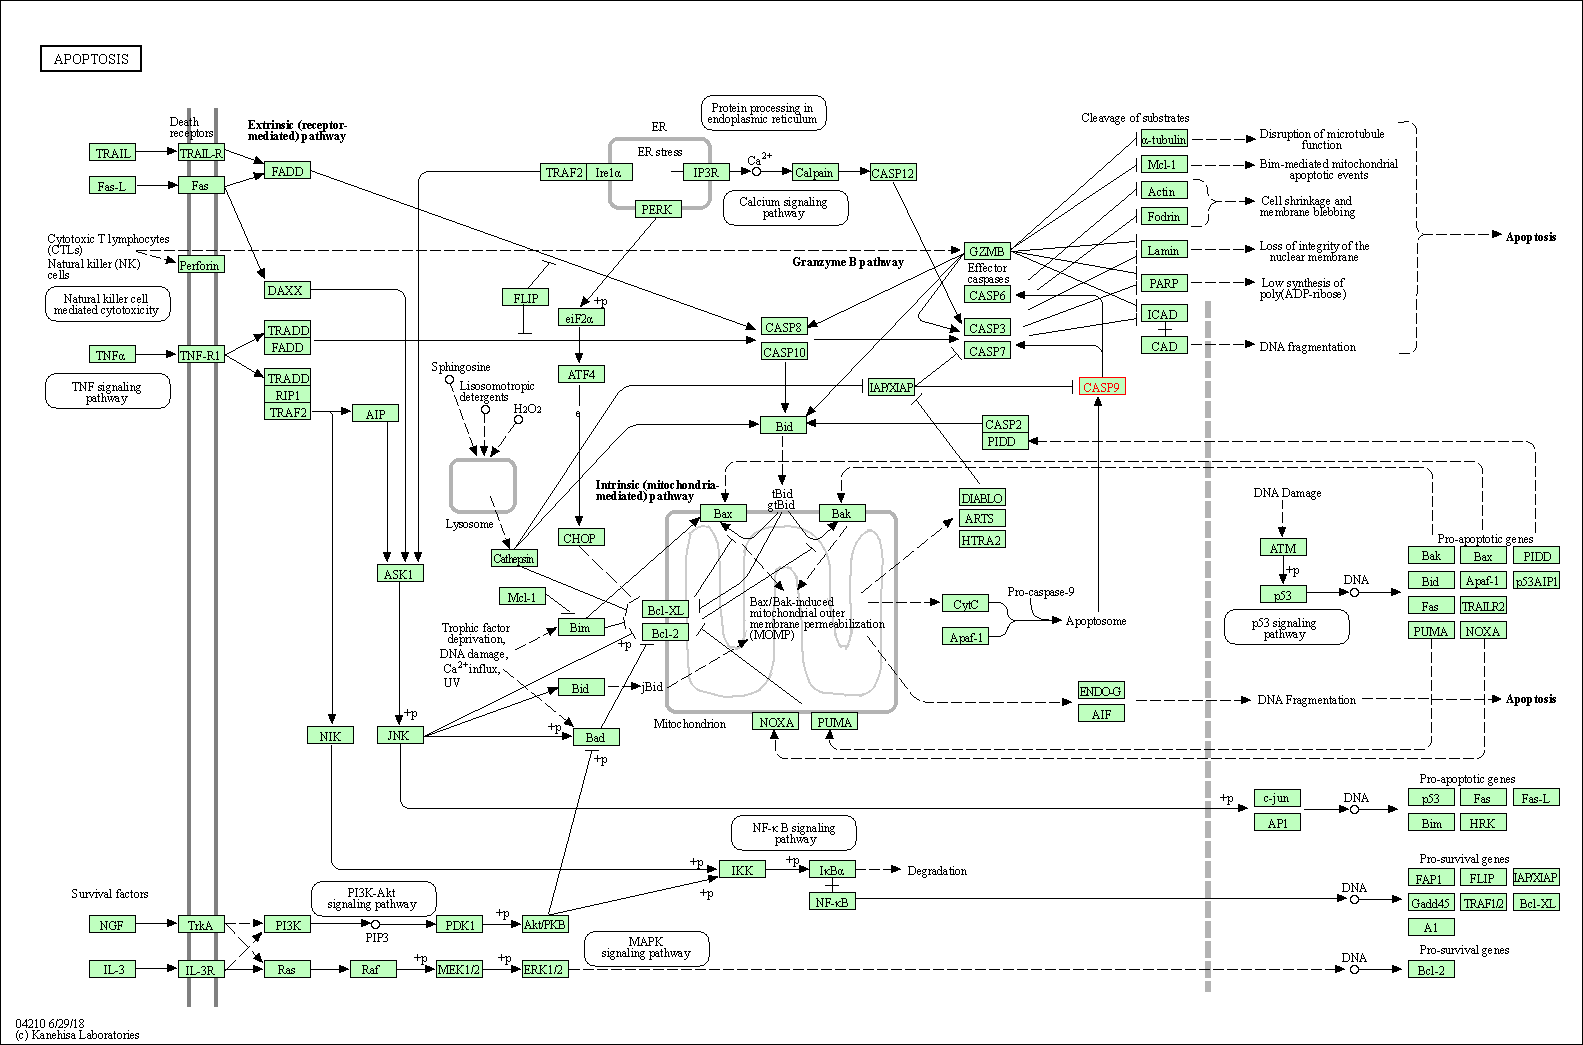
| Representative Experiment Reporting the Effect of This Combination | [2] | |||||
| Detail(s) |
Combination Info
|
|||||
| Molecule(s)
Regulation |
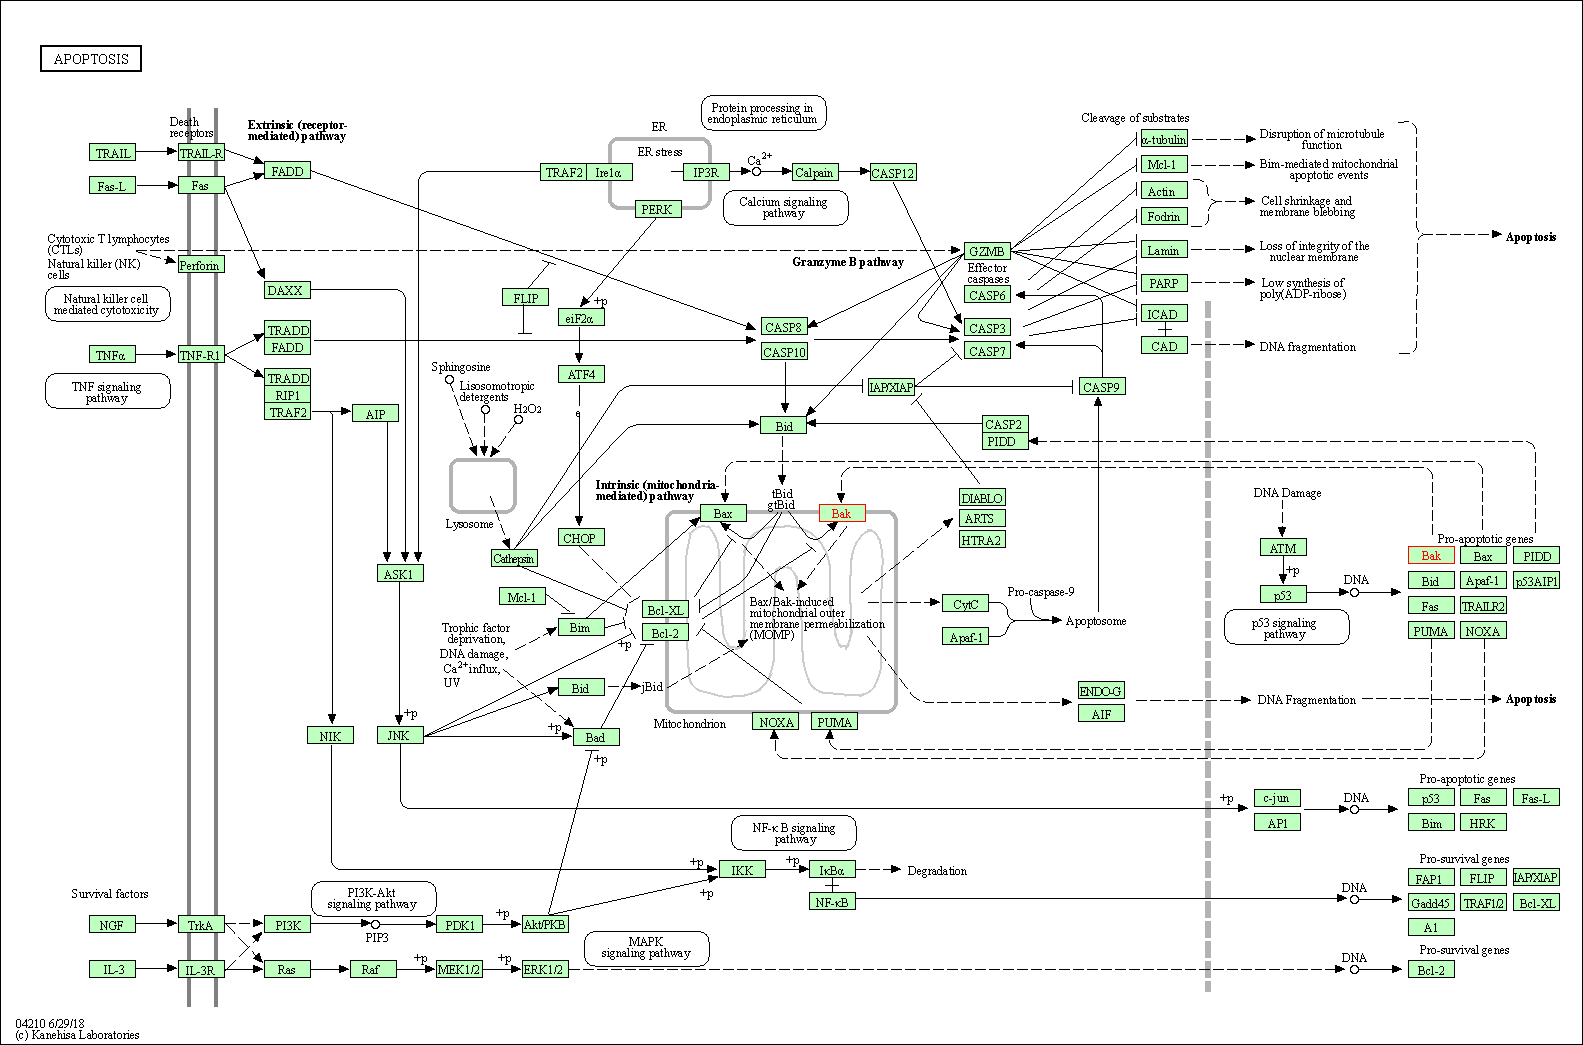
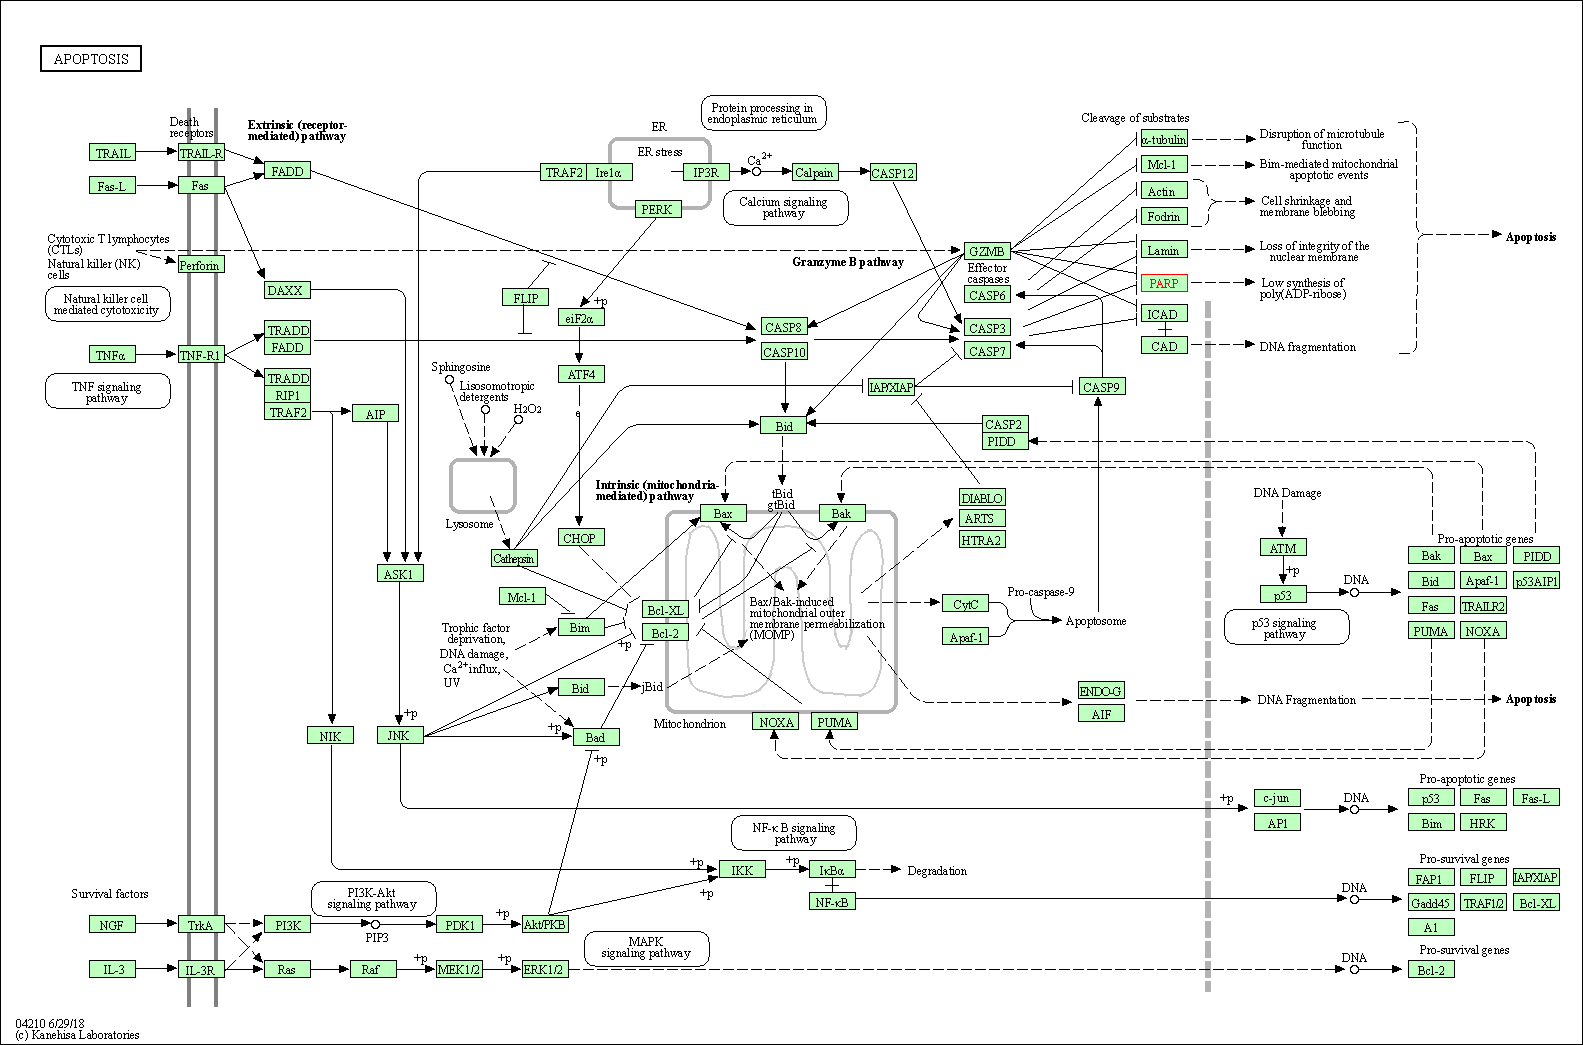
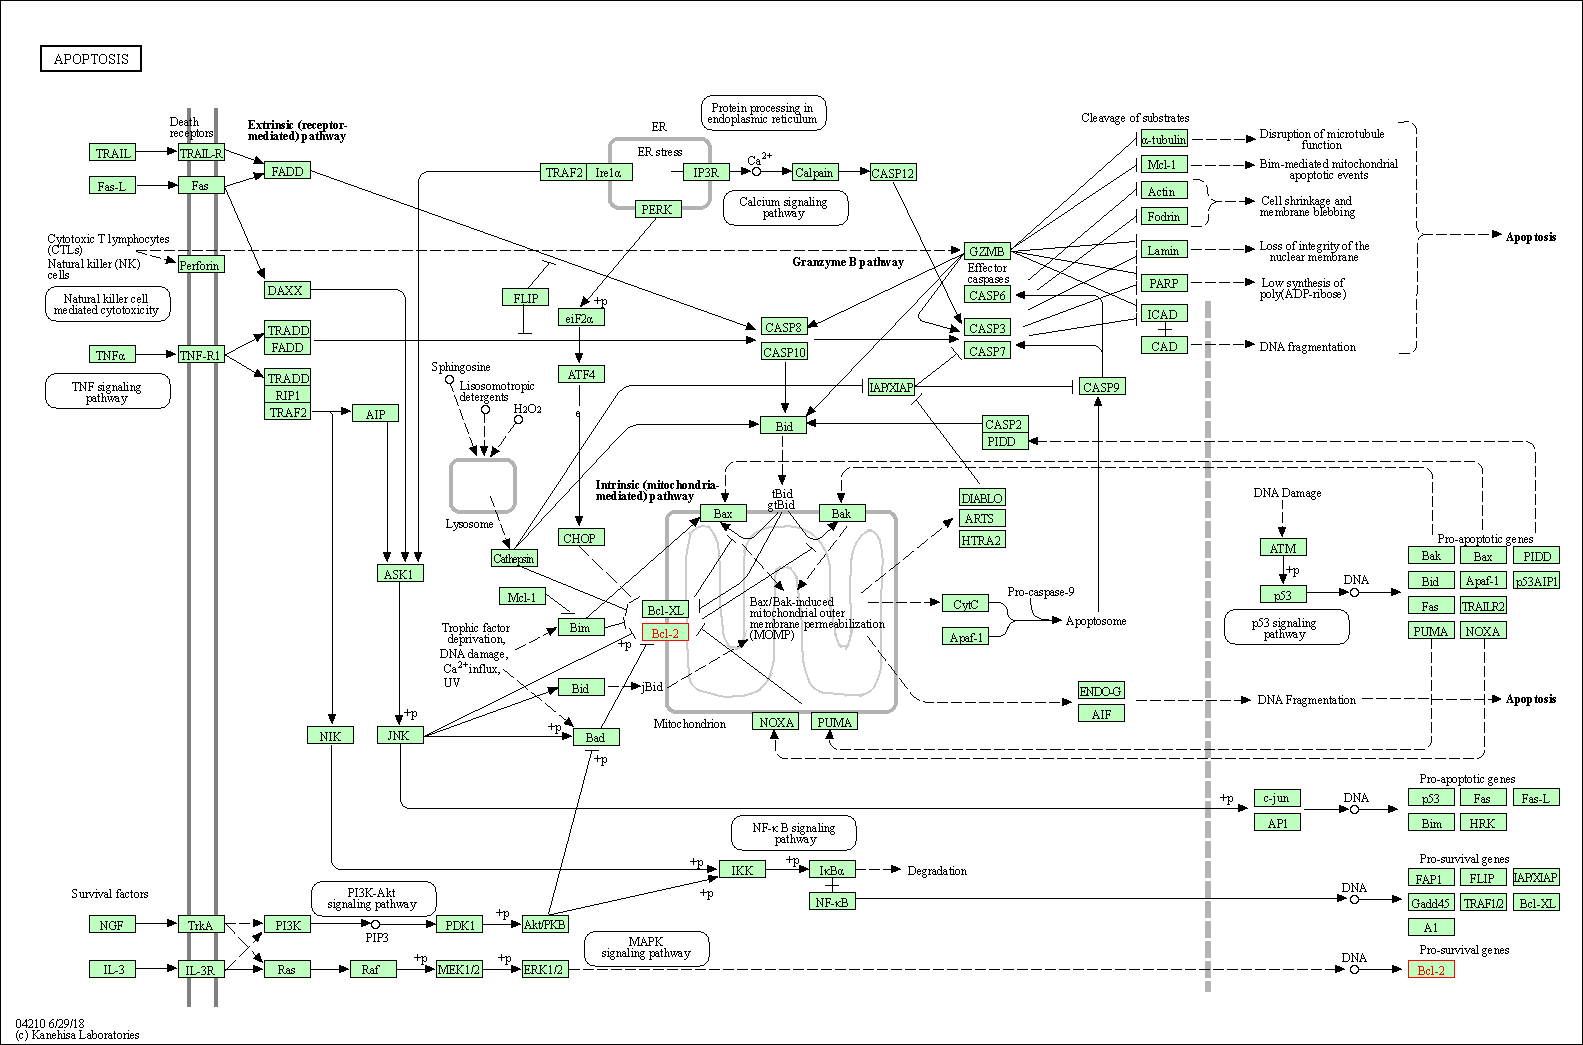
Up-regulation | Expression | BAK | Molecule Info |
Pathway MAP
|
|
| Up-regulation | Expression | BID | Molecule Info |
Pathway MAP
|
||
| Down-regulation | Expression | BIRC5 | Molecule Info |
Pathway MAP
|
||
| Up-regulation | Expression | CASP3 | Molecule Info |
Pathway MAP
|
||
| Up-regulation | Expression | CASP7 | Molecule Info |
Pathway MAP
|
||
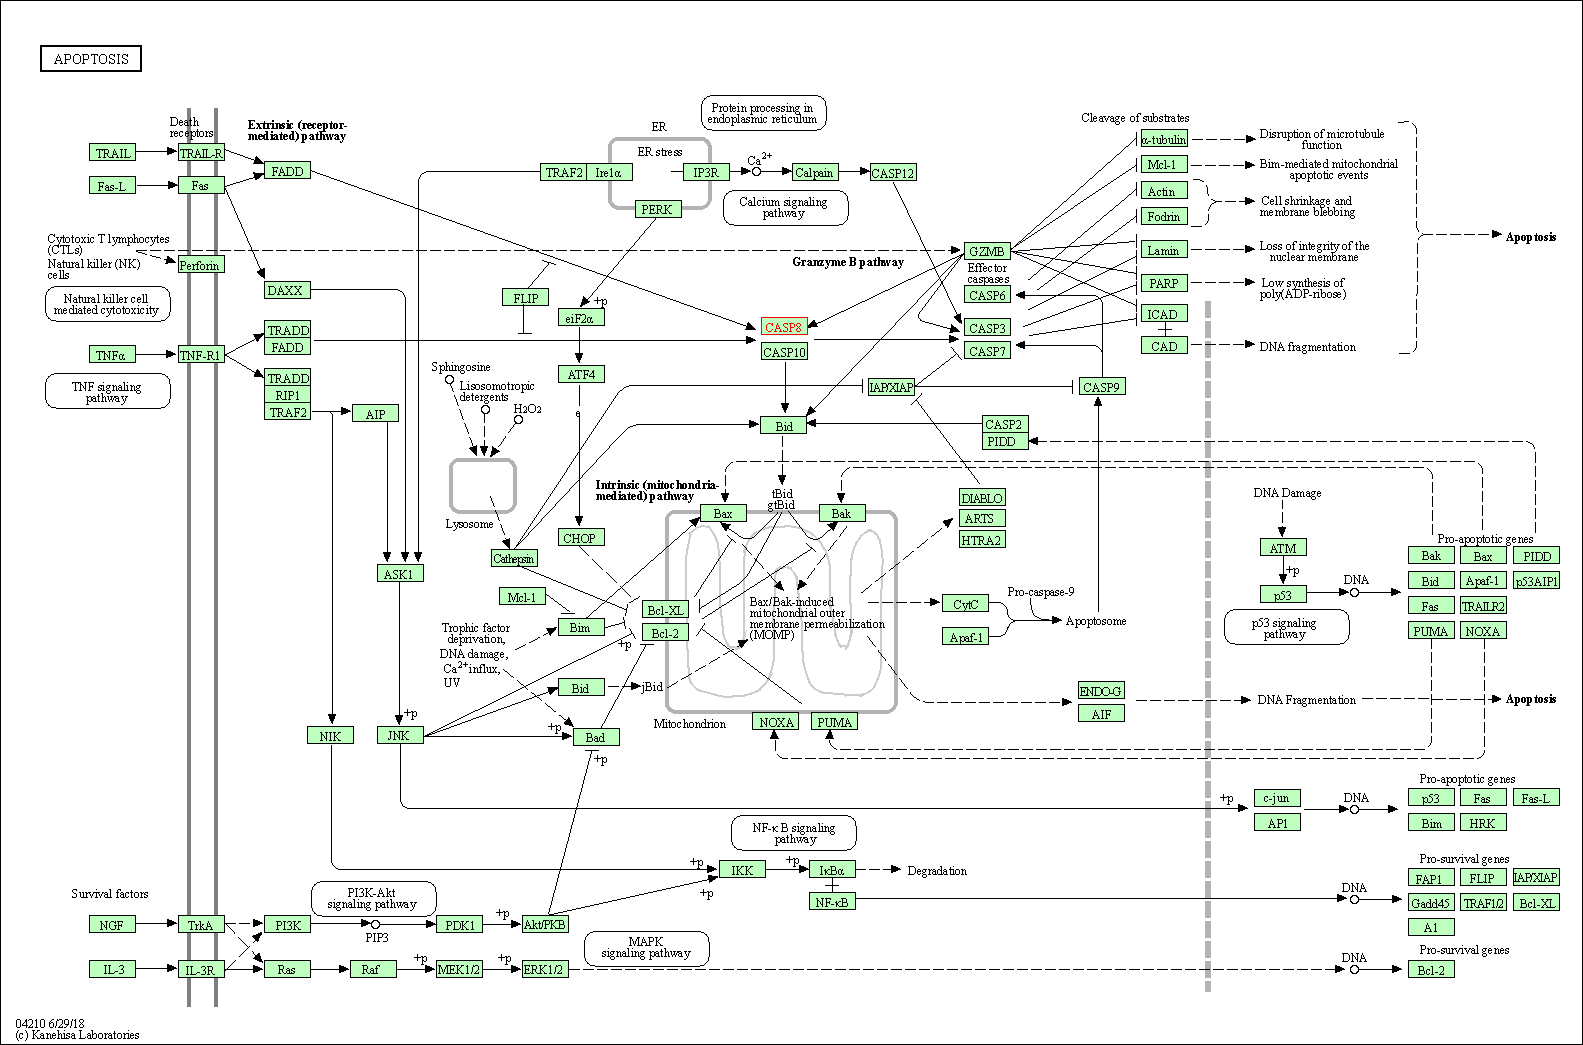
| Up-regulation | Expression | CASP8 | Molecule Info |
Pathway MAP
|
||
| Up-regulation | Expression | CASP9 | Molecule Info |
Pathway MAP
|
||
| Down-regulation | Expression | CCNB1 | Molecule Info |
Pathway MAP
|
||
| Up-regulation | Expression | CDKN1A | Molecule Info |
Pathway MAP
|
||
| Up-regulation | Expression | TP53 | Molecule Info |
Pathway MAP
|
||
| In-vitro Model | NT2-D1 | CVCL_3407 | Embryonal carcinoma | Homo sapiens | ||
| In-vivo Model | NT2/D1 cells (106) mixed with Matrigel were implanted into 6-week-old athymic nude mice bearing the nu/nu gene [NIH(s) (nu/nu)] and housed under pathogen-free conditions. | |||||
| Experimental
Result(s) |
Addition of fisetin to cisplatin activates both the mitochondrial and the cell death receptor pathway and could be a promising regimen for the elimination of embryonal carcinoma cells. | |||||
| Cabazitaxel | Breast cancer | Click to Show/Hide the Molecular Data of This Drug | ||||
| Achieving Therapeutic Synergy | Click to Show/Hide | |||||
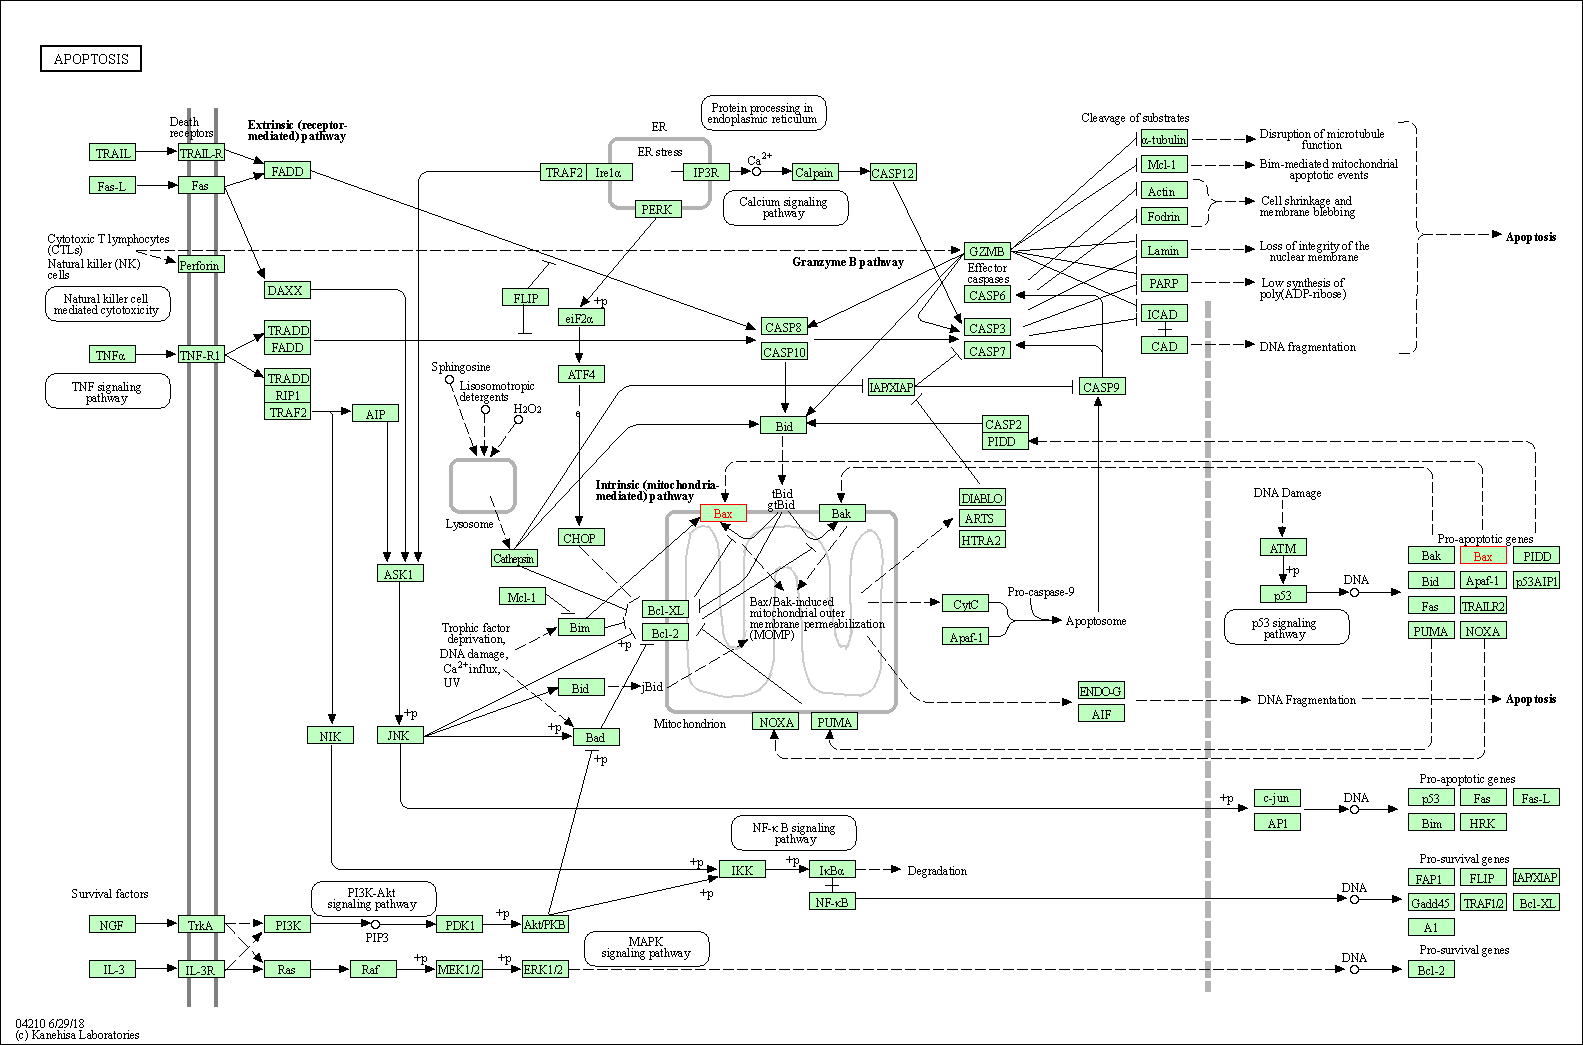
| Representative Experiment Reporting the Effect of This Combination | [3] | |||||
| Detail(s) |
Combination Info
|
|||||
| Molecule(s)
Regulation |
Down-regulation | Expression | ABCB1 | Molecule Info |
Pathway MAP
|
|
| Up-regulation | Expression | BAX | Molecule Info |
Pathway MAP
|
||
| Up-regulation | Expression | MCL1 | Molecule Info |
Pathway MAP
|
||
| Down-regulation | Expression | MKI67 | Molecule Info | |||
| Down-regulation | Expression | MMP-2 | Molecule Info |
Pathway MAP
|
||
| Down-regulation | Expression | MMP-9 | Molecule Info |
Pathway MAP
|
||
| Up-regulation | Expression | PARP1 | Molecule Info |
Pathway MAP
|
||
| Down-regulation | Expression | PCNA | Molecule Info |
Pathway MAP
|
||
| Down-regulation | Expression | PECAM1 | Molecule Info |
Pathway MAP
|
||
| Down-regulation | Expression | PRAP1 | Molecule Info |
Pathway MAP
|
||
| In-vitro Model | LNCaP C4-2 | CVCL_4782 | Prostate carcinoma | Homo sapiens | ||
| A-549 | CVCL_0023 | Lung adenocarcinoma | Homo sapiens | |||
| PrEC | Prostate cancer | Homo sapiens | ||||
| 22Rv1 | Prostate cancer | Homo sapiens | ||||
| In-vivo Model | A total of 24 athymic nude male mice 6-8 weeks old were injected subcutaneously with 1*106 22Rv1 cells. | |||||
| Experimental
Result(s) |
Fisetin Enhances Chemotherapeutic Effect of Cabazitaxel against Human Prostate Cancer Cells. | |||||
| Sorafenib | Renal cell carcinoma | Click to Show/Hide the Molecular Data of This Drug | ||||
| Achieving Therapeutic Synergy | Click to Show/Hide | |||||
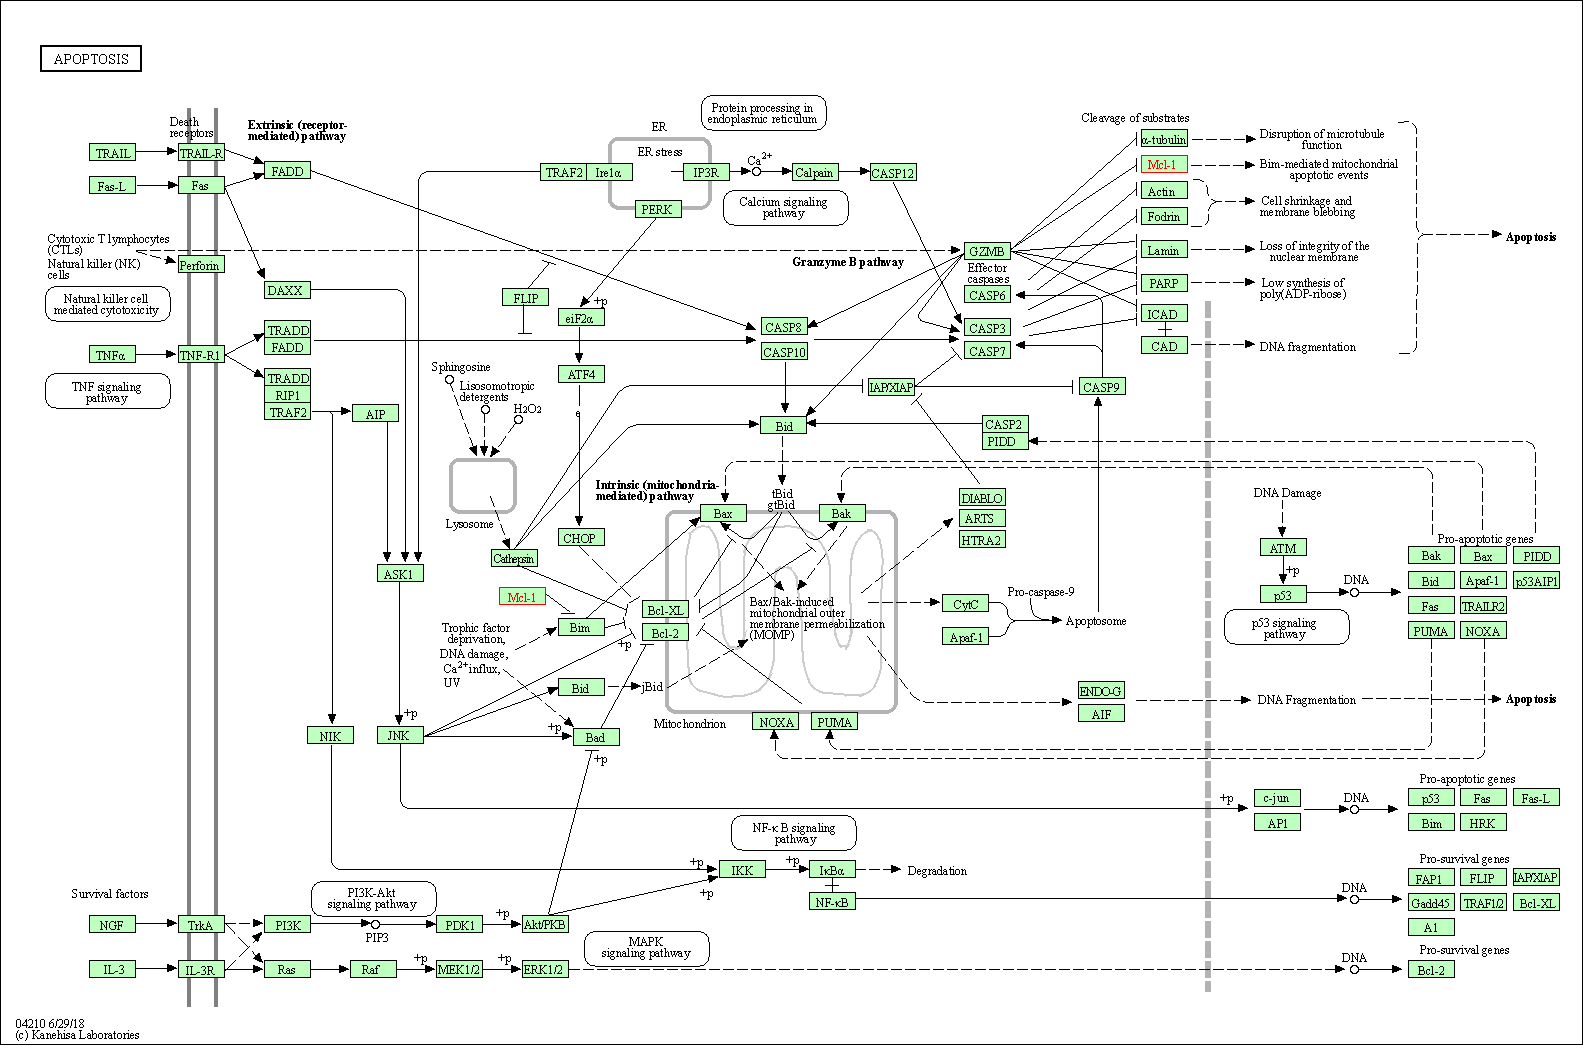
| Representative Experiment Reporting the Effect of This Combination | [4] | |||||
| Detail(s) |
Combination Info
|
|||||
| Molecule(s)
Regulation |
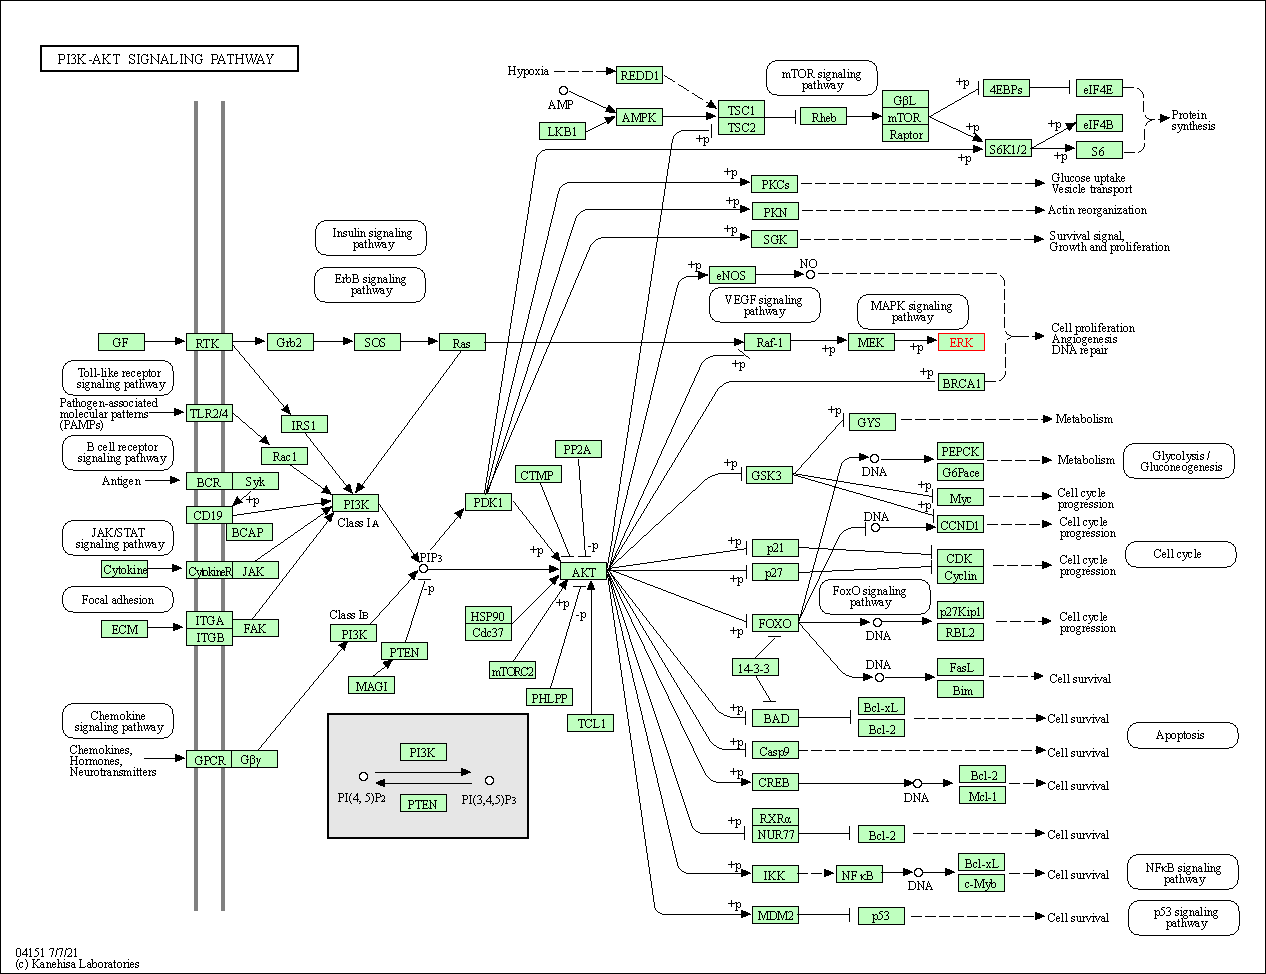
Down-regulation | Expression | AKT1 | Molecule Info |
Pathway MAP
|
|
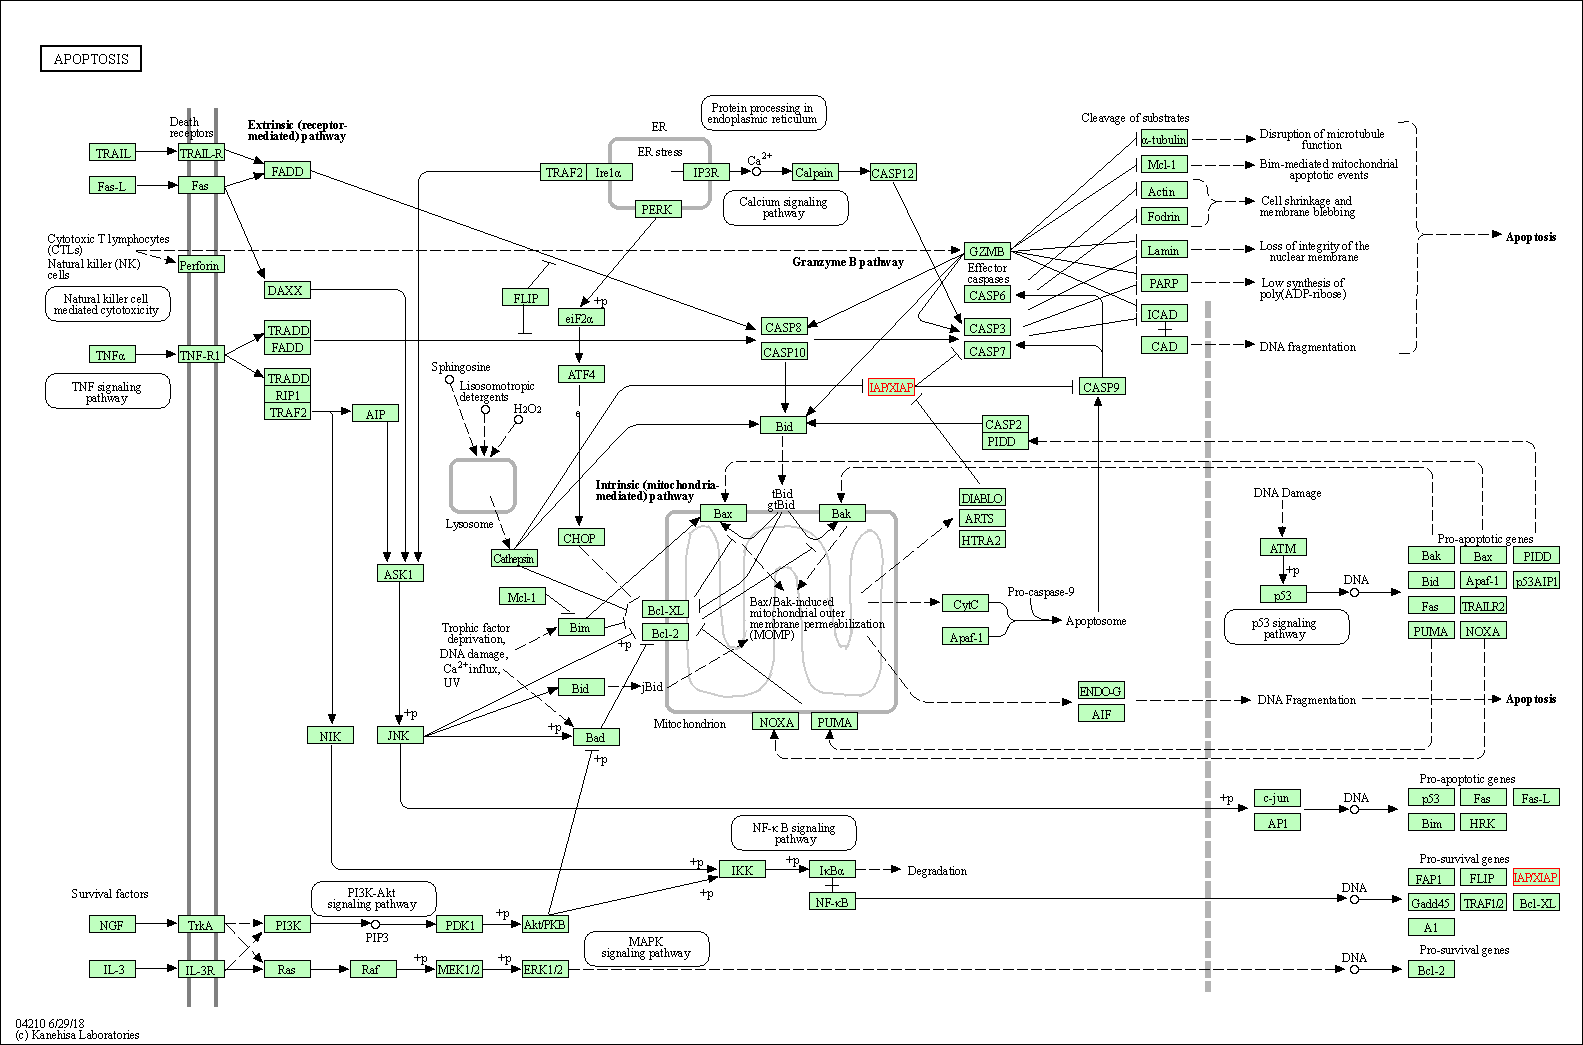
| Up-regulation | Expression | BAK | Molecule Info |
Pathway MAP
|
||
| Up-regulation | Expression | BAX | Molecule Info |
Pathway MAP
|
||
| Down-regulation | Expression | BCL-2 | Molecule Info |
Pathway MAP
|
||
| Up-regulation | Expression | CASP3 | Molecule Info |
Pathway MAP
|
||
| Down-regulation | Expression | ERK1 | Molecule Info |
Pathway MAP
|
||
| Down-regulation | Expression | ERK1 | Molecule Info |
Pathway MAP
|
||
| Down-regulation | Expression | MCL1 | Molecule Info |
Pathway MAP
|
||
| Down-regulation | Phosphorylation | MEK1 | Molecule Info |
Pathway MAP
|
||
| Down-regulation | Phosphorylation | MEK2 | Molecule Info |
Pathway MAP
|
||
| Down-regulation | Expression | mTOR | Molecule Info |
Pathway MAP
|
||
| Up-regulation | Expression | PARP1 | Molecule Info |
Pathway MAP
|
||
| Down-regulation | Expression | PIK3CB | Molecule Info |
Pathway MAP
|
||
| In-vitro Model | A-375 | CVCL_0132 | Amelanotic melanoma | Homo sapiens | ||
| RPMI-7951 | CVCL_1666 | Melanoma | Homo sapiens | |||
| In-vivo Model | Mice were subcutaneously inoculated with 0.1ml of 2.5*106 A375 cells or 5*106 SK-MEL-28 cells (prepared in a 50ul media + 50ul matrigel) in each flank to initiate tumor growth. | |||||
| Experimental
Result(s) |
Fisetin potentiates sorafenib-induced apoptosis and abrogates tumor growth in athymic nude mice implanted with BRAF-mutated melanoma cells. | |||||
| 5-fluorouracil | Solid tumour/cancer | Click to Show/Hide the Molecular Data of This Drug | ||||
| Augmenting Drug Sensitivity | Click to Show/Hide | |||||
| Representative Experiment Reporting the Effect of This Combination | [5] | |||||
| Detail(s) |
Combination Info
|
|||||
| Molecule(s)
Regulation |
Down-regulation | Phosphorylation | AKT1 | Molecule Info |
Pathway MAP
|
|
| Down-regulation | Phosphorylation | mTOR | Molecule Info |
Pathway MAP
|
||
| Down-regulation | Expression | PIK3CB | Molecule Info |
Pathway MAP
|
||
| Up-regulation | Expression | PRKAA1 | Molecule Info |
Pathway MAP
|
||
| In-vitro Model | SW480 | CVCL_0546 | Colon adenocarcinoma | Homo sapiens | ||
| HCT 116 | CVCL_0291 | Colon carcinoma | Homo sapiens | |||
| HT-29 | CVCL_0320 | Colon adenocarcinoma | Homo sapiens | |||
| Experimental
Result(s) |
Treatment of PIK3CA-mutant cells with fisetin and 5-FU reduced the expression of PI3K, phosphorylation of AKT, mTOR, its target proteins, constituents of mTOR signaling complex and this treatment increased the phosphorylation of AMPKalpha. | |||||
| Cyclophosphamide | Solid tumour/cancer | Click to Show/Hide the Molecular Data of This Drug | ||||
| Achieving Therapeutic Synergy | Click to Show/Hide | |||||
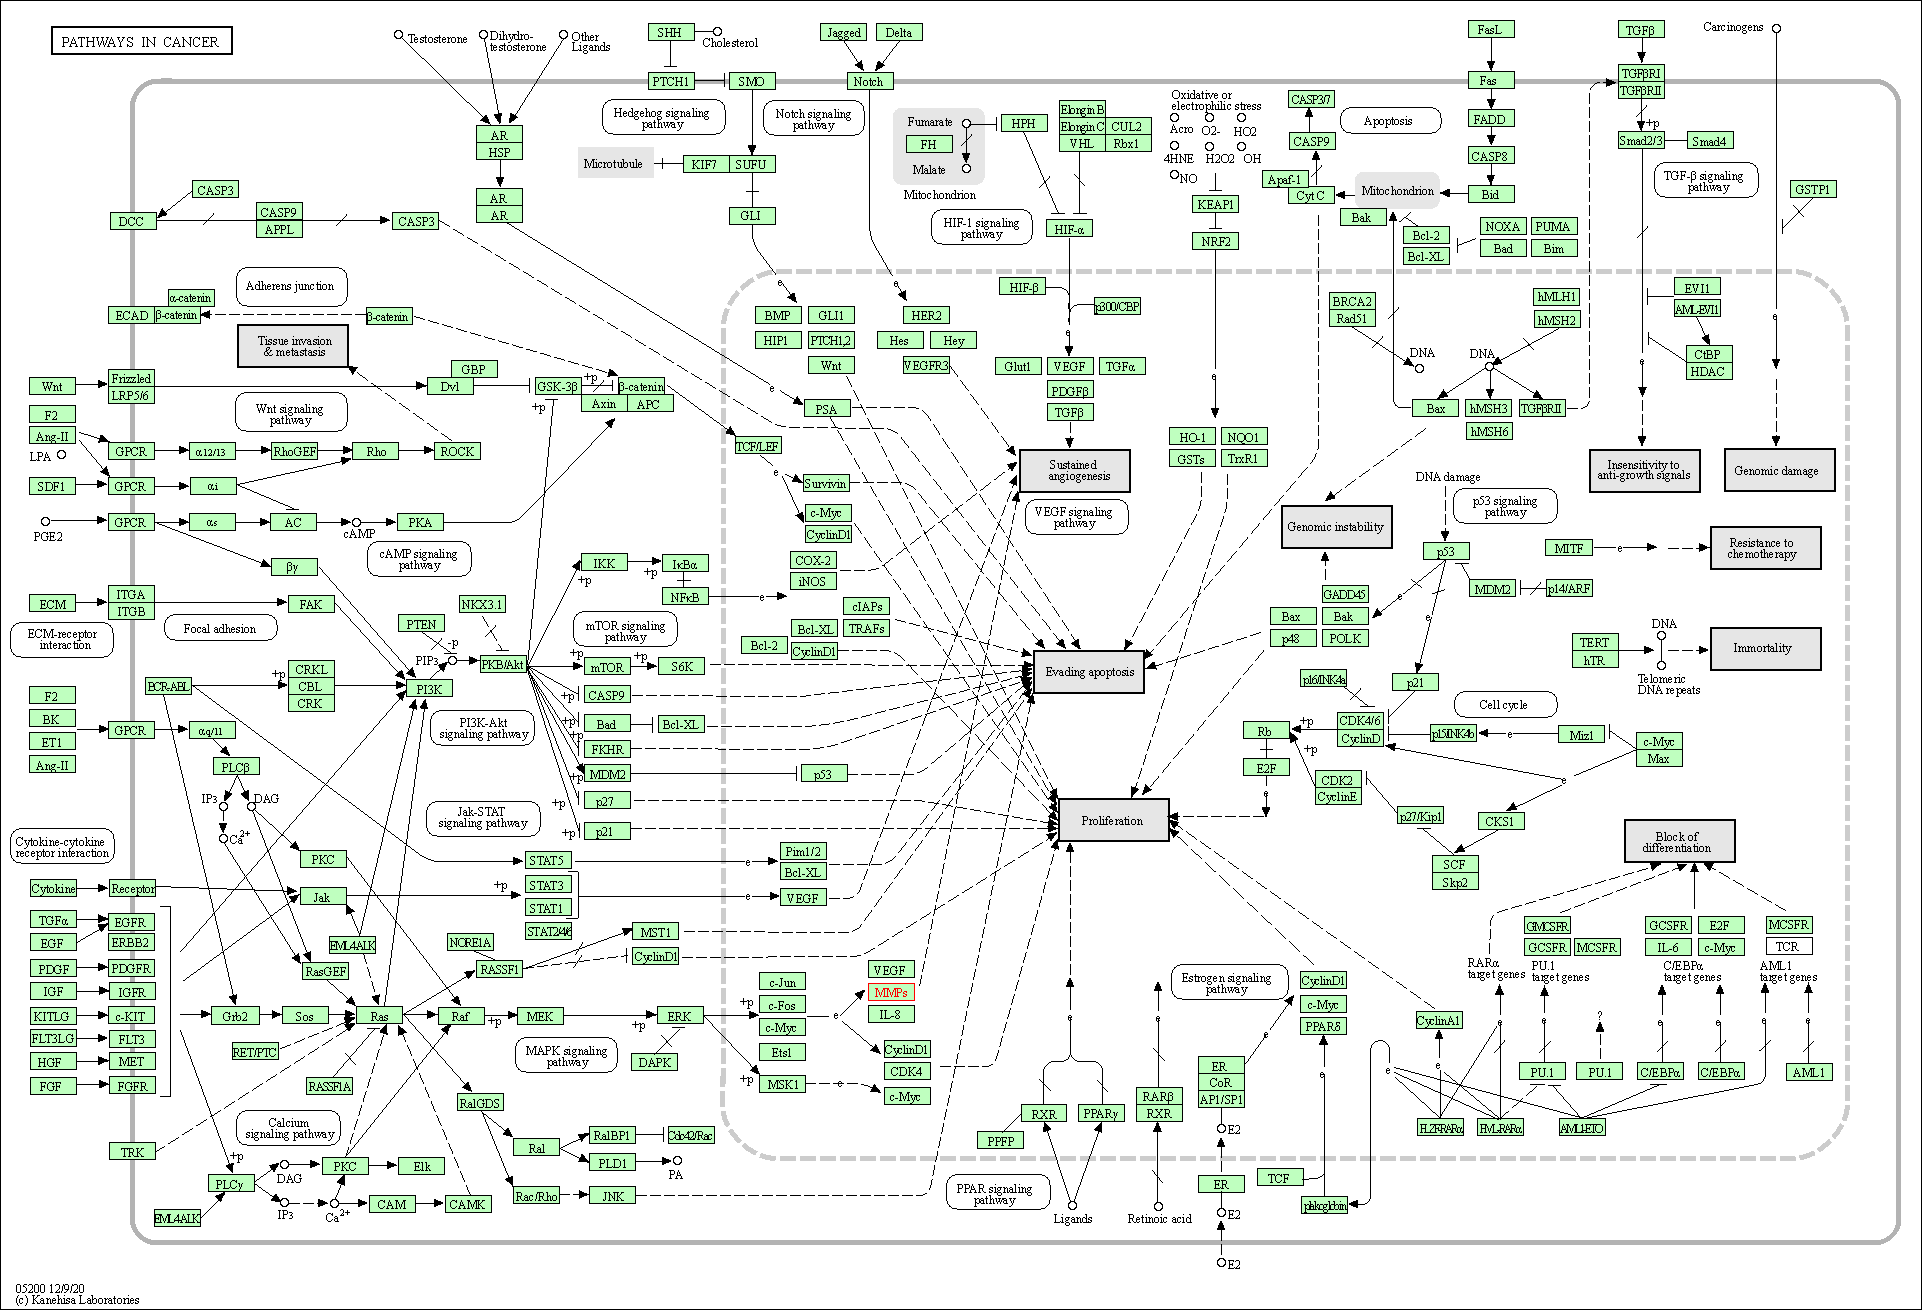
| Representative Experiment Reporting the Effect of This Combination | [6] | |||||
| Detail(s) |
Combination Info
|
|||||
| Molecule(s)
Regulation |
Down-regulation | Expression | PECAM1 | Molecule Info |
Pathway MAP
|
|
| In-vitro Model | EA.hy 926 | CVCL_3901 | Healthy | Homo sapiens | ||
| 3LL | CVCL_5653 | Malignant tumors | Mus musculus | |||
| NIH 3T3 | CVCL_0594 | Healthy | Mus musculus | |||
| In-vivo Model | Aliquots of cells (0.1 ml, 3 * 106 cells) were mixed with 0.2 ml of phenol red-free Matrigel and injected into the right flank of mice. | |||||
| Experimental
Result(s) |
Fisetin not only displays in vitro and in vivo antiangiogenic properties, but also can markedly improve the in vivo antitumour effect of CPA. | |||||
| Gemcitabine | Solid tumour/cancer | Click to Show/Hide the Molecular Data of This Drug | ||||
| Achieving Therapeutic Synergy | Click to Show/Hide | |||||
| Representative Experiment Reporting the Effect of This Combination | [7] | |||||
| Detail(s) |
Combination Info
|
|||||
| Molecule(s)
Regulation |
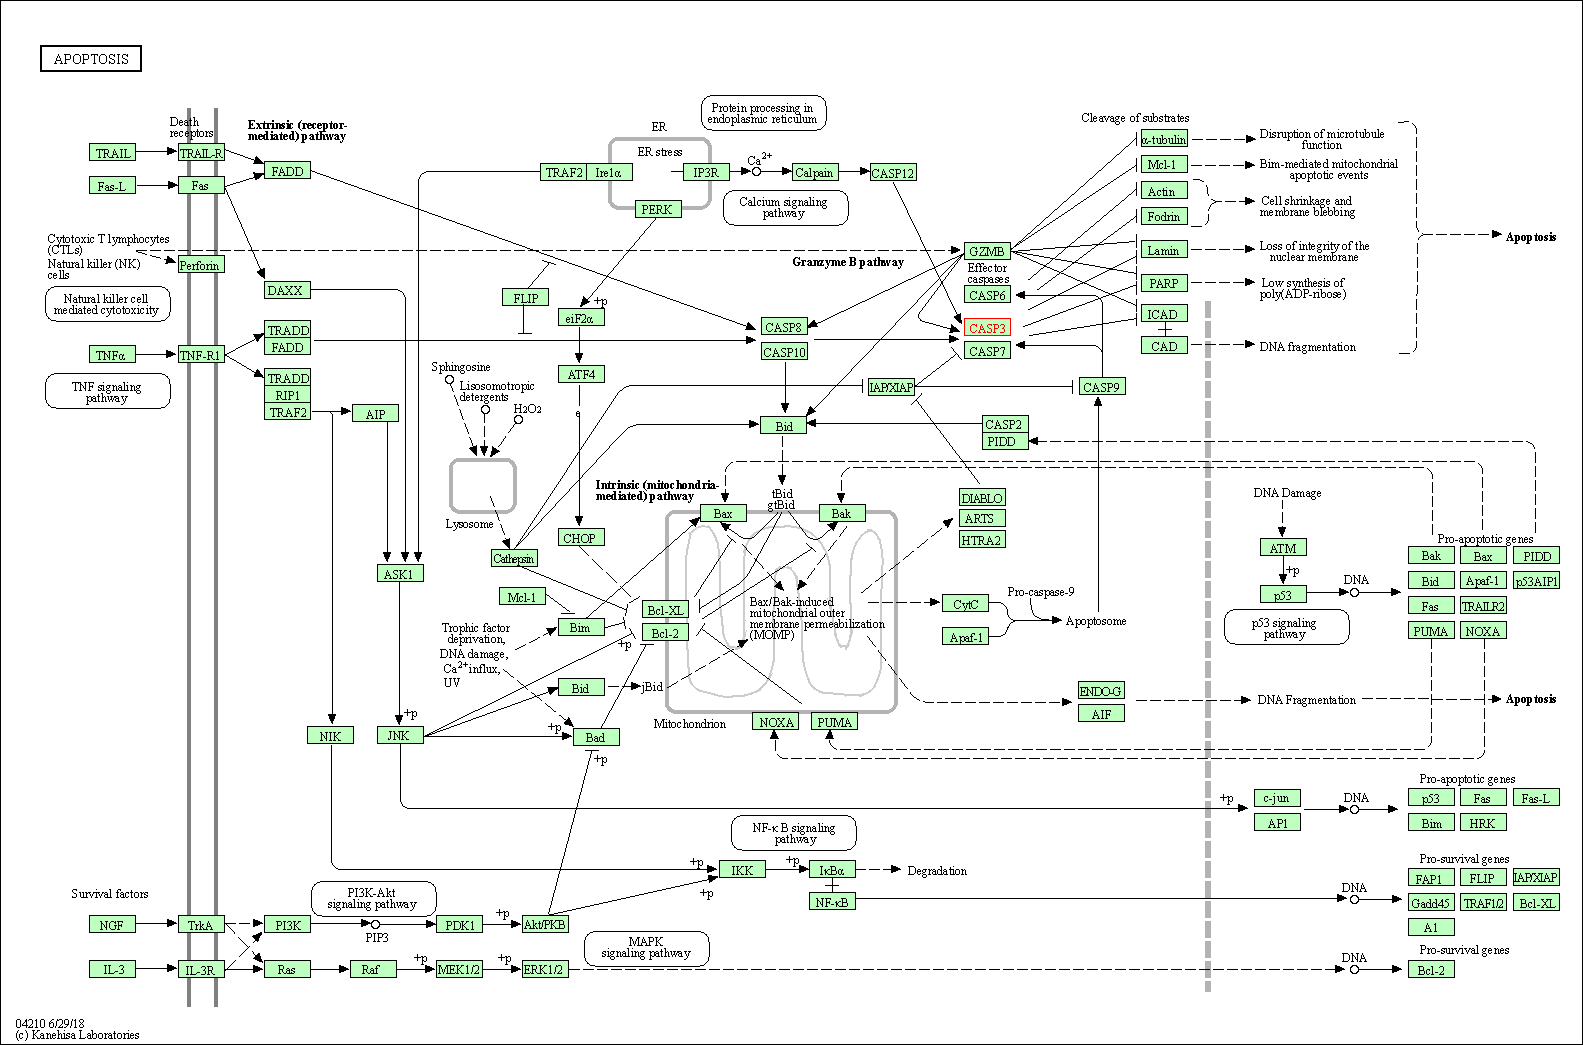
Up-regulation | Expression | CASP3 | Molecule Info |
Pathway MAP
|
|
| Up-regulation | Expression | CASP7 | Molecule Info |
Pathway MAP
|
||
| Down-regulation | Expression | ERK1 | Molecule Info |
Pathway MAP
|
||
| Down-regulation | Expression | ERK2 | Molecule Info |
Pathway MAP
|
||
| Down-regulation | Expression | MYC | Molecule Info |
Pathway MAP
|
||
| In-vitro Model | MIA PaCa-2 | CVCL_0428 | Pancreatic ductal adenocarcinoma | Homo sapiens | ||
| Experimental
Result(s) |
Fisetin sensitized human pancreatic cancer cells to gemcitabine-induced cytotoxicity through inhibition of ERK-MYC signaling. | |||||
| Etoposide | Testicular carcinoma | Click to Show/Hide the Molecular Data of This Drug | ||||
| Augmenting Drug Sensitivity | Click to Show/Hide | |||||
| Representative Experiment Reporting the Effect of This Combination | [8] | |||||
| Detail(s) |
Combination Info
|
|||||
| Molecule(s)
Regulation |
Down-regulation | Expression | CCNB1 | Molecule Info |
Pathway MAP
|
|
| Down-regulation | Expression | CCNE1 | Molecule Info |
Pathway MAP
|
||
| In-vitro Model | MG-63 | CVCL_0426 | Osteosarcoma | Homo sapiens | ||
| SaOS-2 | CVCL_0548 | Osteosarcoma | Homo sapiens | |||
| U2OS | CVCL_0042 | Osteosarcoma | Homo sapiens | |||
| Experimental
Result(s) |
The combination of fisetin with etoposide has higher anti-proliferative effects in osteosarcoma associated with cell cycle arrest, allowing the use of lower doses of the chemotherapeutic agent. | |||||
| Target and Pathway | ||||
|---|---|---|---|---|
| Target(s) | Cyclin-dependent kinase 6 (CDK6) | Molecule Info | [9] | |
| Fatty acid synthase (FASN) | Molecule Info | [10] | ||
| Plasmodium 3-oxoacyl-acyl-carrier reductase (Malaria fabG) | Molecule Info | [10] | ||
| Plasmodium enoyl-ACP reductase (Malaria fabI) | Molecule Info | [10] | ||
| Plasmodium Fatty acid synthesis protein (Malaria FabZ) | Molecule Info | [10] | ||
| BioCyc | Fatty acid biosynthesis initiation | Click to Show/Hide | ||
| 2 | Fatty acid elongation -- saturated | |||
| 3 | Palmitate biosynthesis | |||
| KEGG Pathway | Fatty acid biosynthesis | Click to Show/Hide | ||
| 2 | Metabolic pathways | |||
| 3 | Fatty acid metabolism | |||
| 4 | AMPK signaling pathway | |||
| 5 | Insulin signaling pathway | |||
| 6 | Cell cycle | |||
| 7 | p53 signaling pathway | |||
| 8 | PI3K-Akt signaling pathway | |||
| 9 | Hepatitis B | |||
| 10 | Measles | |||
| 11 | Pathways in cancer | |||
| 12 | Viral carcinogenesis | |||
| 13 | MicroRNAs in cancer | |||
| 14 | Pancreatic cancer | |||
| 15 | Glioma | |||
| 16 | Melanoma | |||
| 17 | Chronic myeloid leukemia | |||
| 18 | Small cell lung cancer | |||
| 19 | Non-small cell lung cancer | |||
| 20 | Fatty acid biosynthesis | |||
| 21 | Biotin metabolism | |||
| 22 | Metabolic pathways | |||
| 23 | Fatty acid metabolism | |||
| NetPath Pathway | TGF_beta_Receptor Signaling Pathway | Click to Show/Hide | ||
| Pathwhiz Pathway | Fatty Acid Biosynthesis | Click to Show/Hide | ||
| Pathway Interaction Database | p73 transcription factor network | Click to Show/Hide | ||
| 2 | Validated transcriptional targets of deltaNp63 isoforms | |||
| 3 | Coregulation of Androgen receptor activity | |||
| 4 | C-MYB transcription factor network | |||
| 5 | IL2 signaling events mediated by STAT5 | |||
| 6 | Regulation of retinoblastoma protein | |||
| Reactome | ChREBP activates metabolic gene expression | Click to Show/Hide | ||
| 2 | Activation of gene expression by SREBF (SREBP) | |||
| 3 | Fatty Acyl-CoA Biosynthesis | |||
| 4 | Oxidative Stress Induced Senescence | |||
| 5 | Senescence-Associated Secretory Phenotype (SASP) | |||
| 6 | Oncogene Induced Senescence | |||
| 7 | Cyclin D associated events in G1 | |||
| WikiPathways | Fatty Acid Biosynthesis | Click to Show/Hide | ||
| 2 | Nuclear Receptors Meta-Pathway | |||
| 3 | Liver X Receptor Pathway | |||
| 4 | Activation of Gene Expression by SREBP (SREBF) | |||
| 5 | SREBF and miR33 in cholesterol and lipid homeostasis | |||
| 6 | SREBP signalling | |||
| 7 | Metabolism of water-soluble vitamins and cofactors | |||
| 8 | Integration of energy metabolism | |||
| 9 | Fatty acid, triacylglycerol, and ketone body metabolism | |||
| 10 | AMPK Signaling | |||
| 11 | DNA Damage Response | |||
| 12 | G1 to S cell cycle control | |||
| 13 | Wnt Signaling Pathway Netpath | |||
| 14 | Retinoblastoma (RB) in Cancer | |||
| 15 | Signaling Pathways in Glioblastoma | |||
| 16 | Metastatic brain tumor | |||
| 17 | miR-targeted genes in muscle cell - TarBase | |||
| 18 | miR-targeted genes in lymphocytes - TarBase | |||
| 19 | miR-targeted genes in leukocytes - TarBase | |||
| 20 | miR-targeted genes in epithelium - TarBase | |||
| 21 | Mitotic G1-G1/S phases | |||
| 22 | Cell Cycle | |||
| 23 | miRNAs involved in DNA damage response | |||
| 24 | miRNA Regulation of DNA Damage Response | |||