Drug Details
| General Information of the Drug (ID: DR2632) | ||||
|---|---|---|---|---|
| Name |
Vorinostat
|
|||
| Synonyms |
NHNPODA; SAHA; SHH; Zolinza; Merck brand of Vorinostat; OCTANEDIOIC ACID HYDROXYAMIDE PHENYLAMIDE; SAHA cpd; Suberanilohydroxamic acid; Suberoylanilide hydroxamic acid; Vorinostat MSD; Vorinostat [USAN]; M344; MK0683; SKI390; WIN64652; MK-0683; SAHA, Suberoylanilide hydroxamic acid; SW-064652; Zolinza (TN); Vorinostat (JAN/USAN); N1-hydroxy-N8-phenyloctanediamide; Zolinza, MK-0683, SAHA; N'-hydroxy-N-phenyloctanediamide; N-Hydroxy-N'-phenyl octanediamide; N-Hyrdroxy-N'-phenyloctanediamide; N-hydroxy-N'-phenyloctanediamide; N-hydroxy-N'-phenyl-octane-1,8-diotic acid diamide; Vorinostat (HDAC inhibitor)
Click to Show/Hide
|
|||
| Molecular Type |
Small molecule
|
|||
| Disease | Mycosis fungoides [ICD-11: 2B01] | Approved | [1] | |
| Structure |

|
Click to Download Mol2D MOL |
||
| ADMET Property |
BDDCS Class
Biopharmaceutics Drug Disposition Classification System (BDDCS) Class 2: low solubility and high permeability
Clearance
The drug present in the plasma can be removed from the body at the rate of 28 mL/min/kg
Half-life
The concentration or amount of drug in body reduced by one-half in 2 hours
Metabolism
The drug is metabolized via beta-oxidation
Unbound Fraction
The unbound fraction of drug in plasma is 0.29%
Vd
Fluid volume that would be required to contain the amount of drug present in the body at the same concentration as in the plasma 0.5 L/kg
Click to Show/Hide
|
|||
| Click to Show/Hide the Molecular Information and External Link(s) of This Natural Product | ||||
| Formula |
C14H20N2O3
|
|||
| PubChem CID | ||||
| Canonical SMILES |
C1=CC=C(C=C1)NC(=O)CCCCCCC(=O)NO
|
|||
| InChI |
1S/C14H20N2O3/c17-13(15-12-8-4-3-5-9-12)10-6-1-2-7-11-14(18)16-19/h3-5,8-9,19H,1-2,6-7,10-11H2,(H,15,17)(H,16,18)
|
|||
| InChIKey |
WAEXFXRVDQXREF-UHFFFAOYSA-N
|
|||
| CAS Number |
CAS 149647-78-9
|
|||
| GDSC | ||||
| TTD Drug ID | ||||
| DrugBank ID | ||||
| Combinatorial Therapeutic Effect(s) Validated Clinically or Experimentally | ||||||
|---|---|---|---|---|---|---|
| α. A List of Natural Product(s) Able to Enhance the Efficacy of This Drug | ||||||
| Arsenic trioxide | Realgar and orpiment | Click to Show/Hide the Molecular Data of This NP | ||||
| Achieving Therapeutic Synergy | Click to Show/Hide | |||||
| Representative Experiment Reporting the Effect of This Combination | [2] | |||||
| Detail(s) |
Combination Info
|
|||||
| Molecule(s)
Regulation |
Up-regulation | Expression | CDKN1A | Molecule Info |
Pathway MAP
|
|
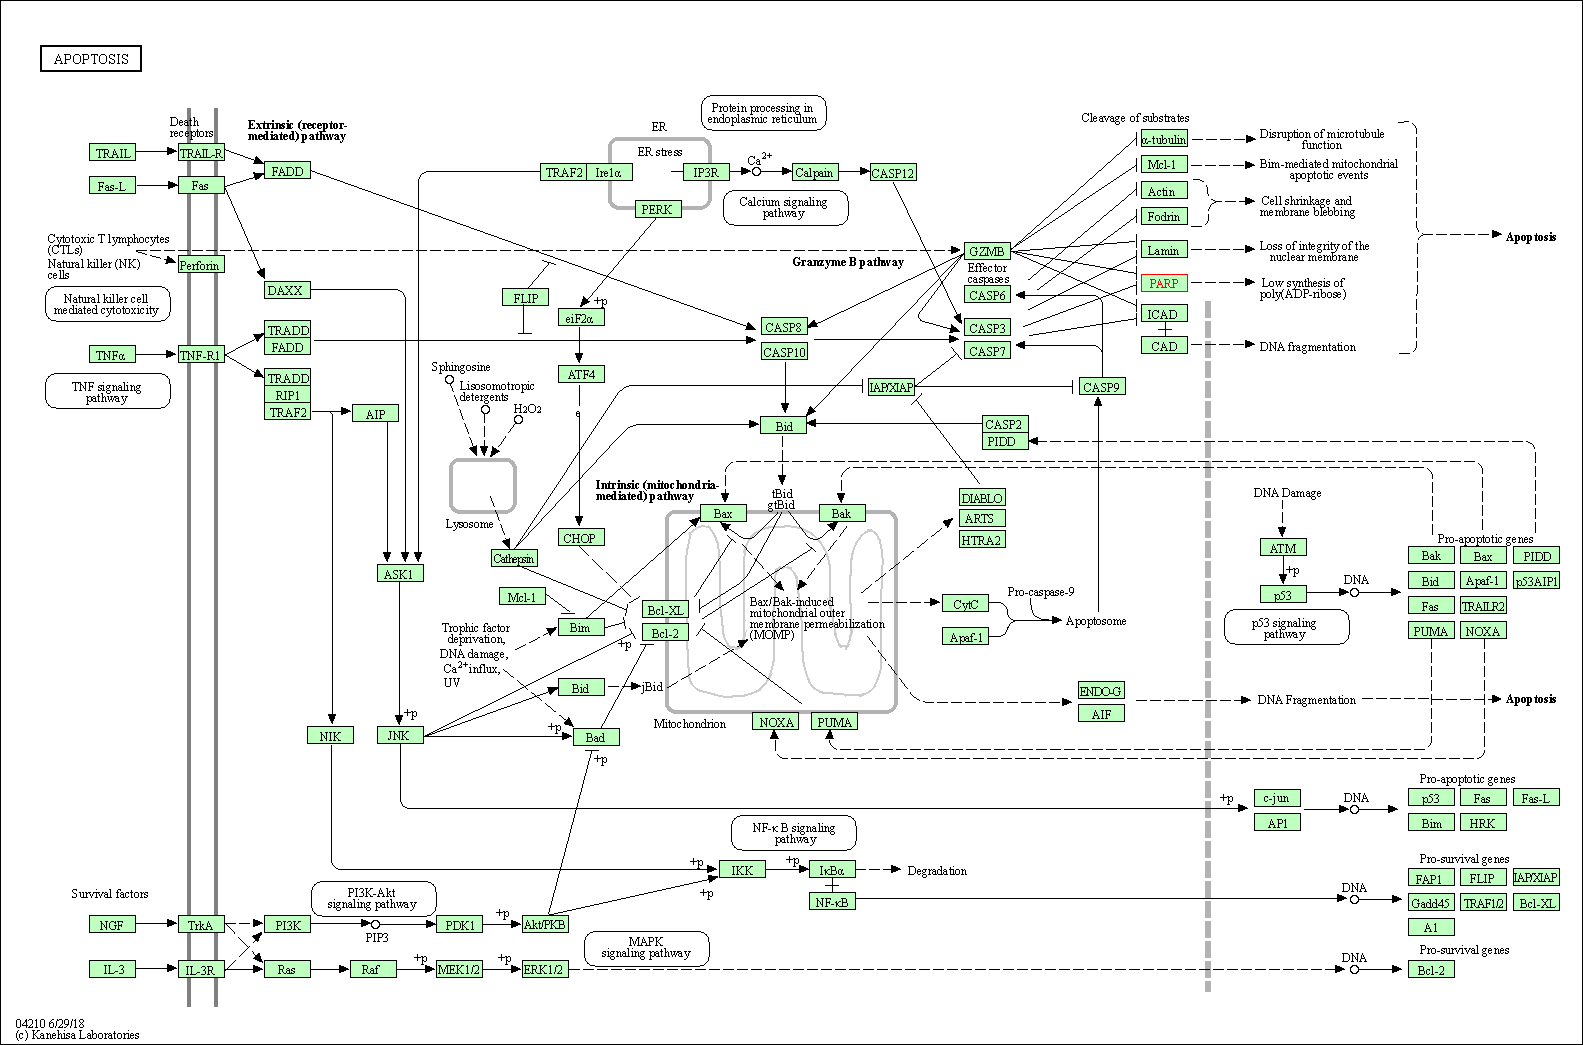
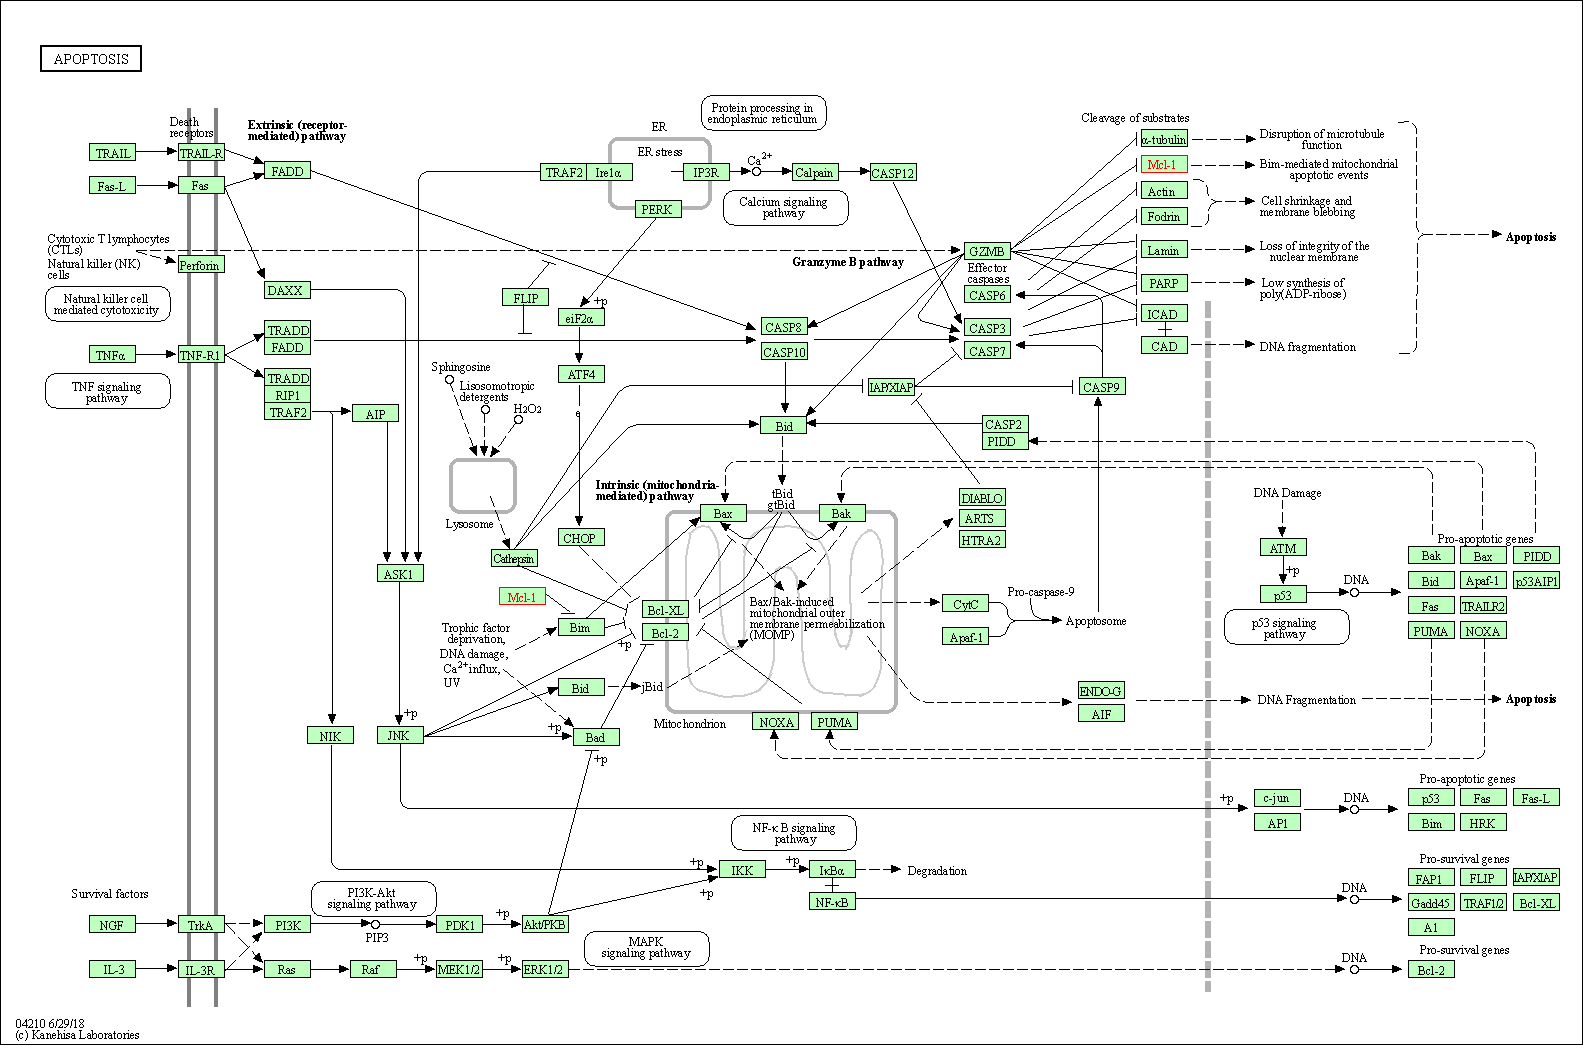
| Up-regulation | Cleavage | PARP1 | Molecule Info |
Pathway MAP
|
||
| In-vitro Model | A-549 | CVCL_0023 | Lung adenocarcinoma | Homo sapiens | ||
| NCI-H1299 | CVCL_0060 | Lung large cell carcinoma | Homo sapiens | |||
| In-vivo Model | Male Balb/c nude mice at 4-6 weeks of age were injected sc in the hind limb with 1 * 107 H1299 cells in 100 ul of phosphate-buffered saline. | |||||
| Experimental
Result(s) |
Combined treatment with ATO and SAHA resulted in enhanced suppression of non-small-cell lung carcinoma in vitro in H1299 cells and in vivo in a xenograft mouse model. | |||||
| Bufalin | Bufo gargarizans | Click to Show/Hide the Molecular Data of This NP | ||||
| Achieving Therapeutic Synergy | Click to Show/Hide | |||||
| Representative Experiment Reporting the Effect of This Combination | [3] | |||||
| Detail(s) |
Combination Info
|
|||||
| Molecule(s)
Regulation |
Up-regulation | Activity | AKT1 | Molecule Info |
Pathway MAP
|
|
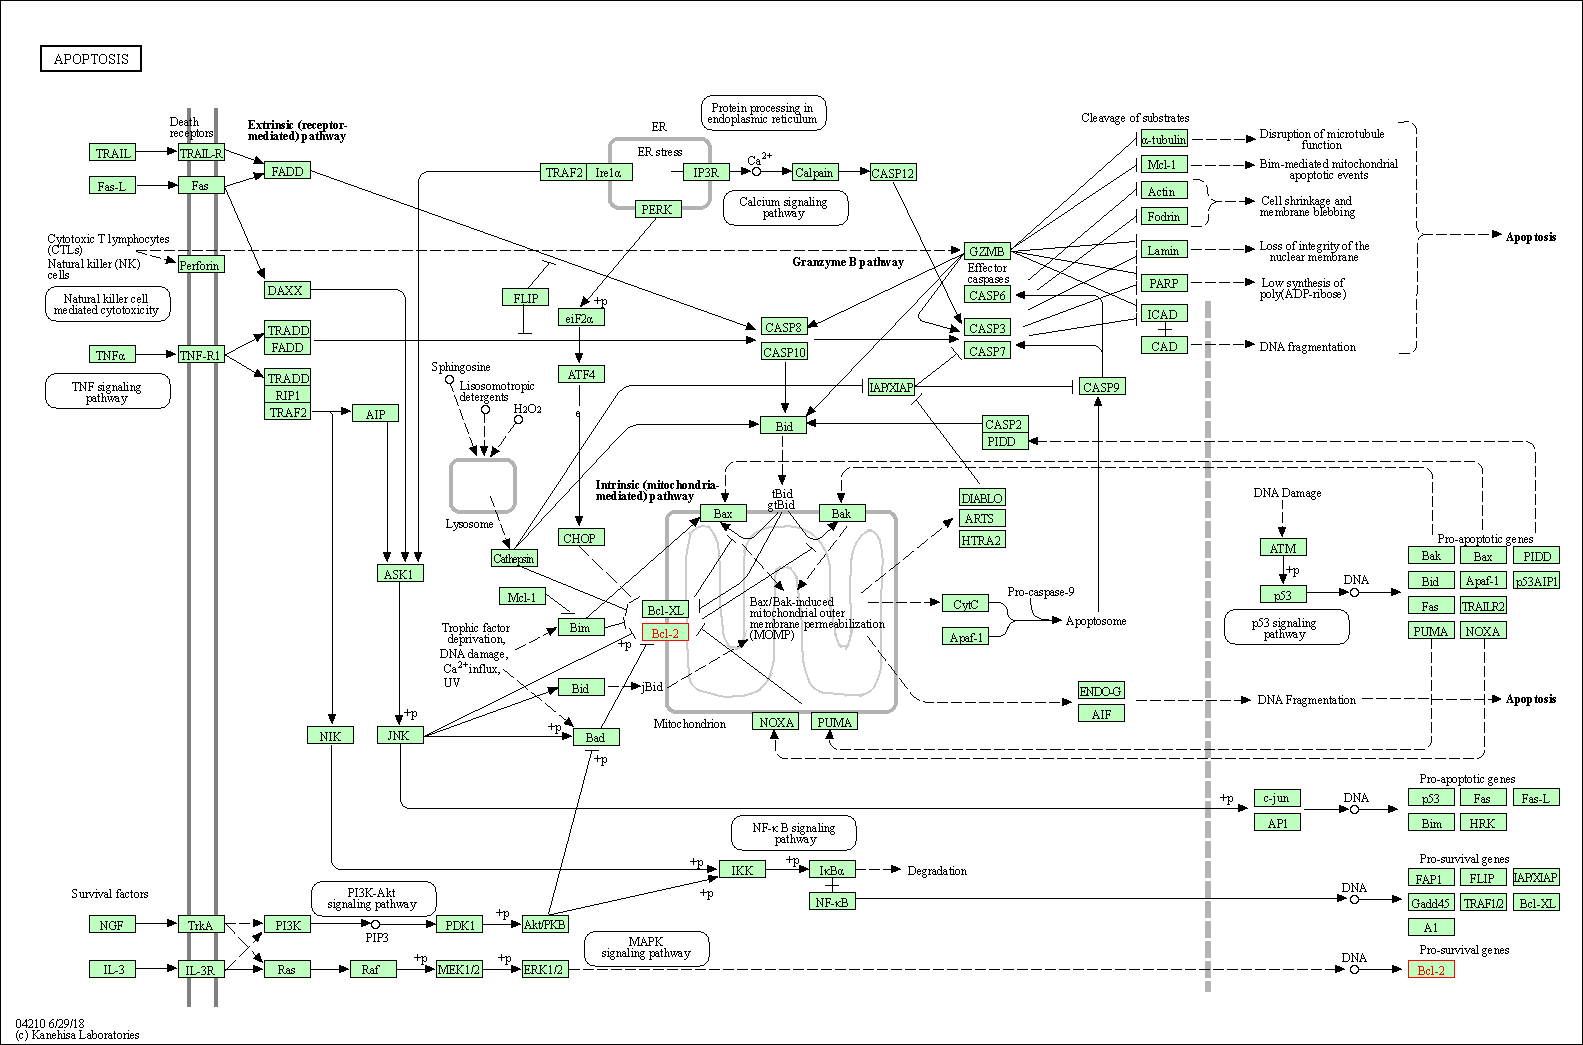
| Down-regulation | Expression | BCL-2 | Molecule Info |
Pathway MAP
|
||
| In-vitro Model | MDA-MB-231 | CVCL_0062 | Breast adenocarcinoma | Homo sapiens | ||
| A-549 | CVCL_0023 | Lung adenocarcinoma | Homo sapiens | |||
| Experimental
Result(s) |
Inhibition of SRC-3 enhances sensitivity of human cancer cells to histone deacetylase inhibitors. | |||||
| Celastrol | Celastrus strigillosus | Click to Show/Hide the Molecular Data of This NP | ||||
| Achieving Therapeutic Synergy | Click to Show/Hide | |||||
| Representative Experiment Reporting the Effect of This Combination | [4] | |||||
| Detail(s) |
Combination Info
|
|||||
| Molecule(s)
Regulation |
Up-regulation | Expression | CDH1 | Molecule Info |
Pathway MAP
|
|
| Up-regulation | Expression | p105 | Molecule Info |
Pathway MAP
|
||
| In-vitro Model | PLA-801D | CVCL_7110 | Lung giant cell carcinoma | Homo sapiens | ||
| In-vivo Model | Human lung cancer xenografts were established by subcutaneously inoculating 5*106 95-D cells into nude mice. | |||||
| Experimental
Result(s) |
The synergistic anticancer effects of celastrol and SAHA was demonstrated due to their reciprocal sensitisation, which was simultaneously regulated by NF-kappaB and E-cadherin. | |||||
| Cladribine | Homo sapiens | Click to Show/Hide the Molecular Data of This NP | ||||
| Achieving Therapeutic Synergy | Click to Show/Hide | |||||
| Representative Experiment Reporting the Effect of This Combination | [5] | |||||
| Detail(s) |
Combination Info
|
|||||
| In-vitro Model | J45.01 | CVCL_2530 | T acute lymphoblastic leukemia | Homo sapiens | ||
| U-937 | CVCL_0007 | Adult acute monocytic leukemia | Homo sapiens | |||
| Experimental
Result(s) |
The Clad+Gem+Bu+SAHA combination provides synergistic cytotoxicity in lymphoma cell lines. | |||||
| Epigallocatechin gallate | Hamamelis virginiana | Click to Show/Hide the Molecular Data of This NP | ||||
| Augmenting Drug Sensitivity | Click to Show/Hide | |||||
| Representative Experiment Reporting the Effect of This Combination | [6] | |||||
| Detail(s) |
Combination Info
|
|||||
| Molecule(s)
Regulation |
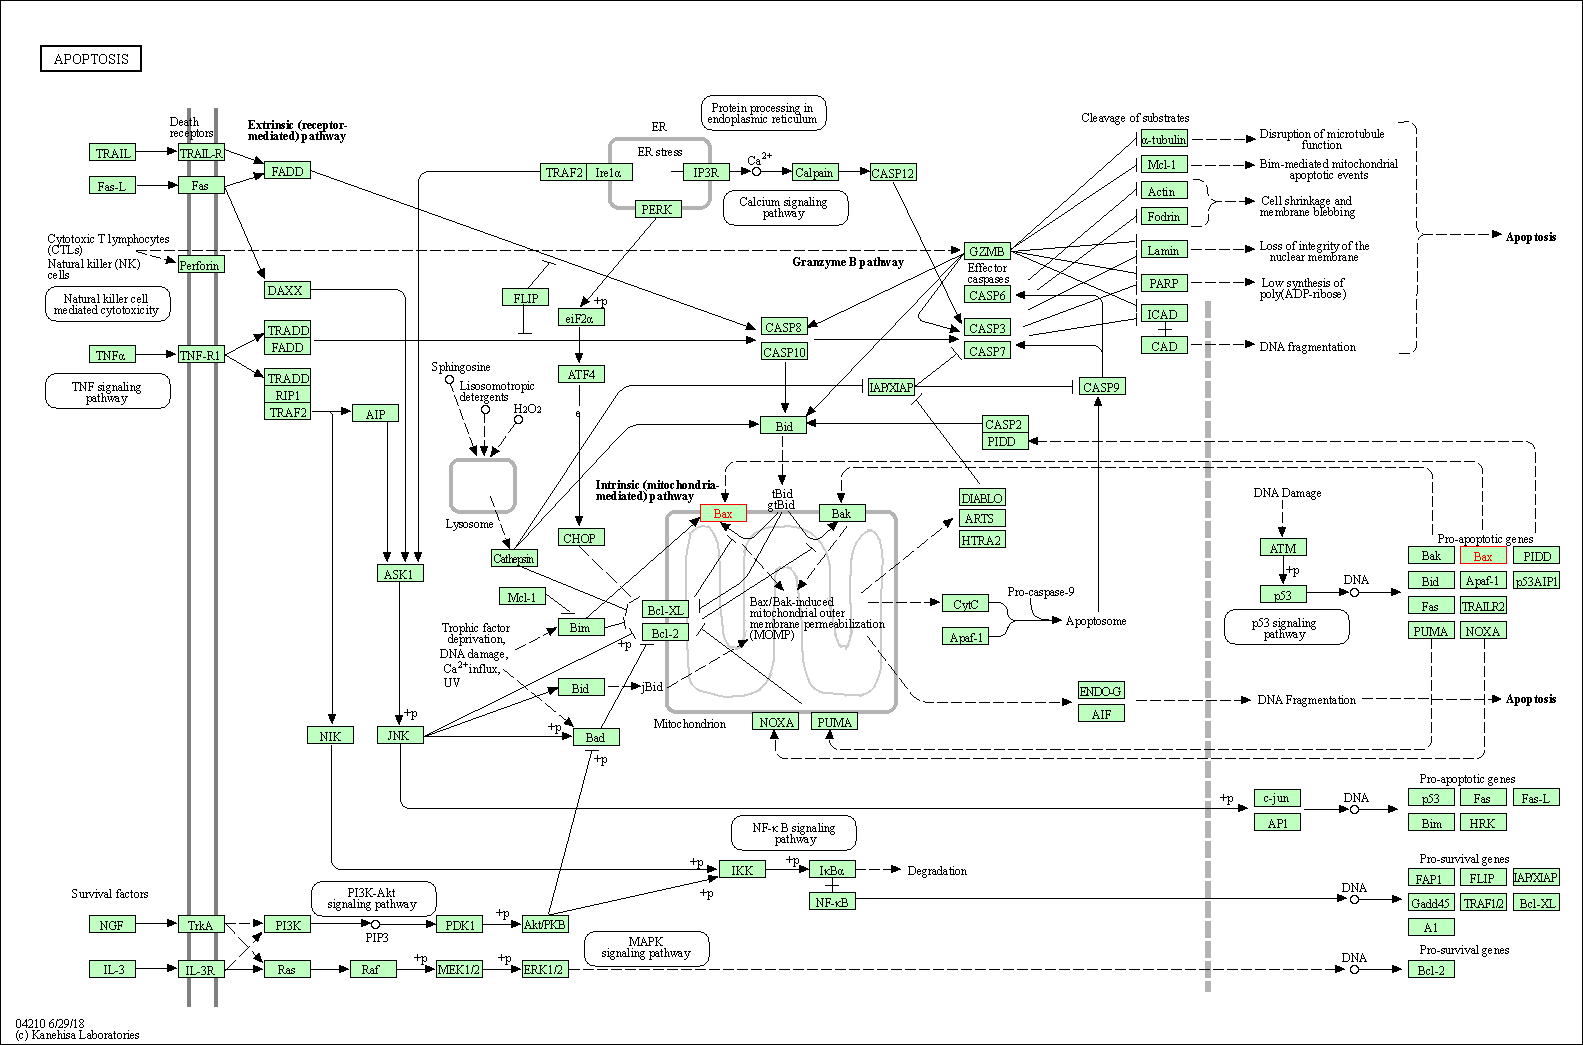
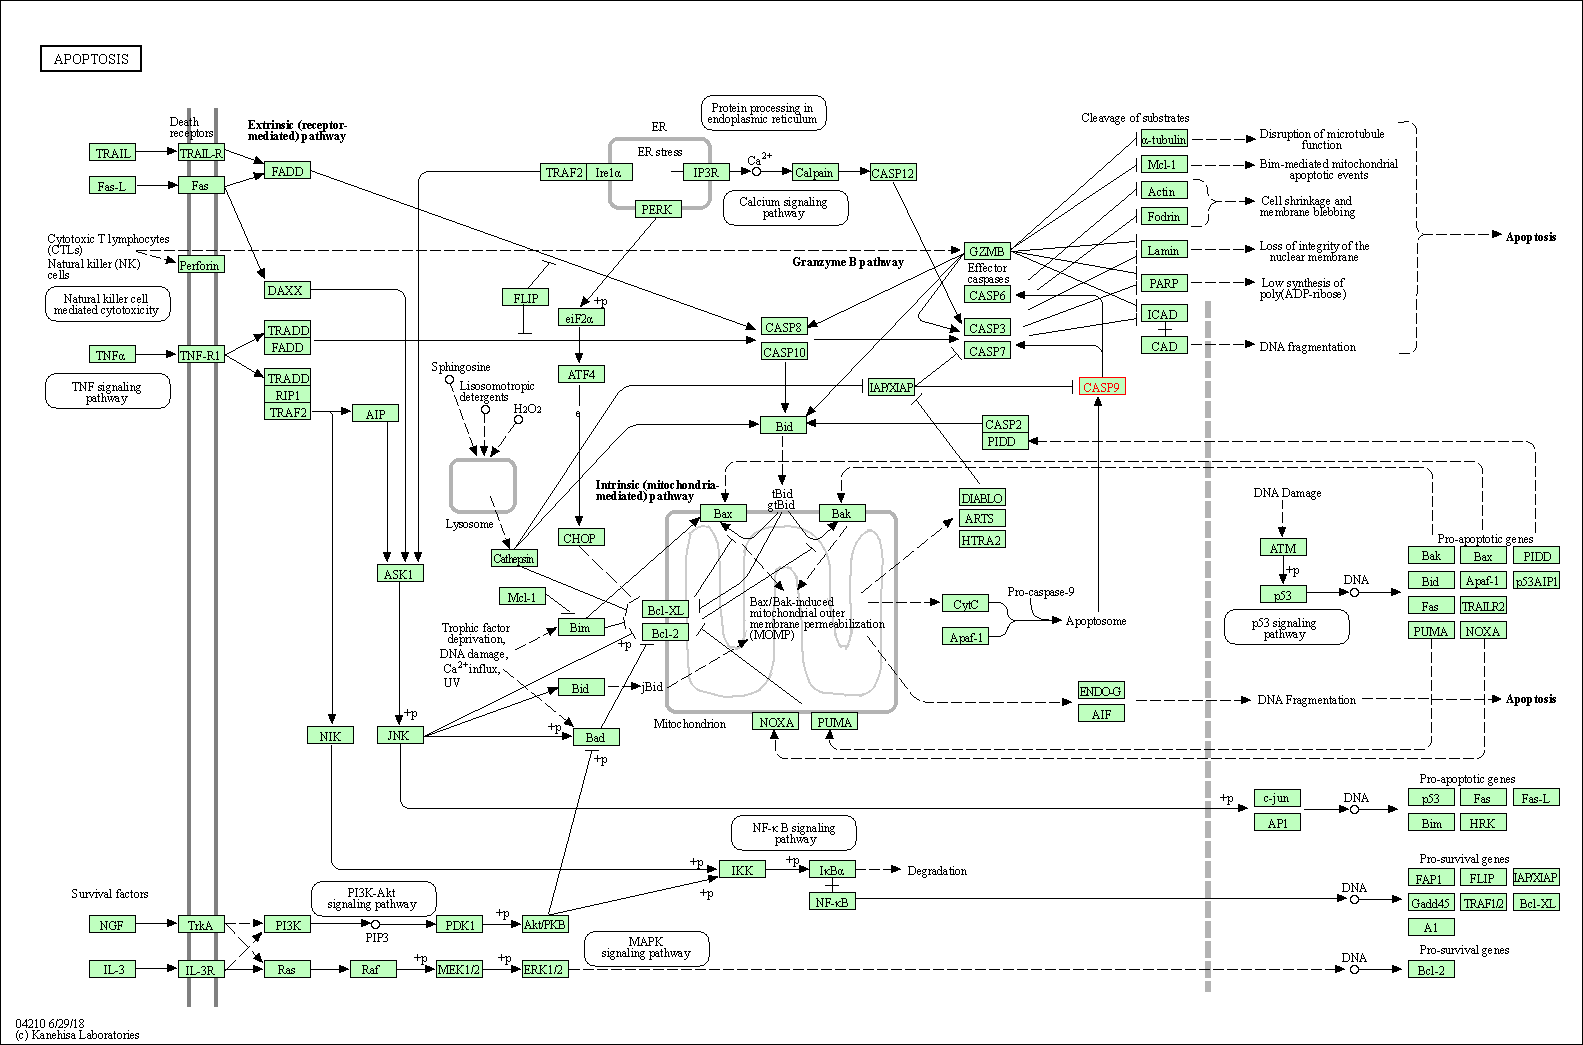
Up-regulation | Expression | BAX | Molecule Info |
Pathway MAP
|
|
| Down-regulation | Expression | BCL-2 | Molecule Info |
Pathway MAP
|
||
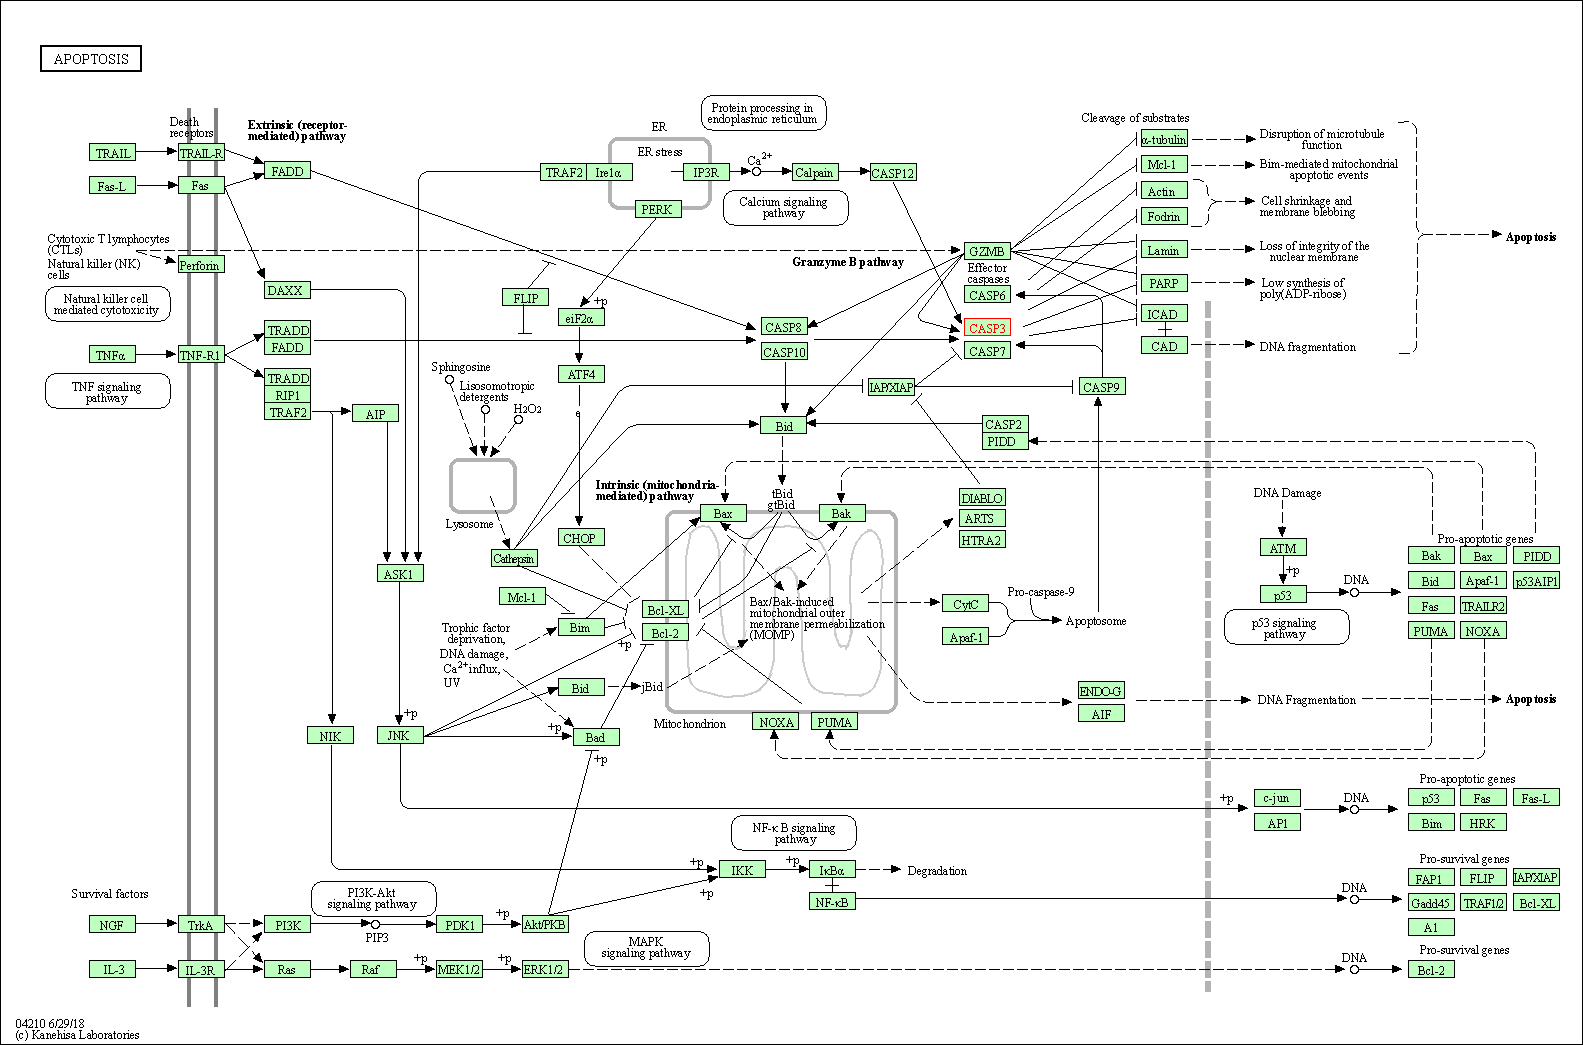
| Up-regulation | Activity | CASP3 | Molecule Info |
Pathway MAP
|
||
| Up-regulation | Activity | CASP7 | Molecule Info |
Pathway MAP
|
||
| Up-regulation | Activity | CASP9 | Molecule Info |
Pathway MAP
|
||
| Down-regulation | Expression | CCNA1 | Molecule Info |
Pathway MAP
|
||
| Down-regulation | Expression | CDK2 | Molecule Info |
Pathway MAP
|
||
| Down-regulation | Expression | CDK4 | Molecule Info |
Pathway MAP
|
||
| Up-regulation | Expression | CDKN1A | Molecule Info |
Pathway MAP
|
||
| Down-regulation | Expression | p105 | Molecule Info |
Pathway MAP
|
||
| In-vitro Model | A-375 | CVCL_0132 | Amelanotic melanoma | Homo sapiens | ||
| Hs 294T | CVCL_0331 | Melanoma | Homo sapiens | |||
| G-361 | CVCL_1220 | Melanoma | Homo sapiens | |||
| Experimental
Result(s) |
The combination treatment resulted in significantly greater inhibition of cell proliferation, increased apoptosis, activation of p21, p27 and caspases (3, 7 and 9) and Bax as well as down-regulation of cdk2, cdk4, cyclin A, NF-kappaB protein p65/RelA and Bcl2 protein and transcript. | |||||
| Flavopiridol | Dysoxylum binectariferum | Click to Show/Hide the Molecular Data of This NP | ||||
| Achieving Therapeutic Synergy | Click to Show/Hide | |||||
| Representative Experiment Reporting the Effect of This Combination | [7] | |||||
| Detail(s) |
Combination Info
|
|||||
| Molecule(s)
Regulation |
Down-regulation | Expression | CCNB1 | Molecule Info |
Pathway MAP
|
|
| Down-regulation | Expression | MAD2L1 | Molecule Info |
Pathway MAP
|
||
| Down-regulation | Expression | MMP-2 | Molecule Info |
Pathway MAP
|
||
| In-vitro Model | CHLA-15 | CVCL_6594 | Neuroblastoma | Homo sapiens | ||
| CHLA-20 | CVCL_6602 | Neuroblastoma | Homo sapiens | |||
| SK-N-BE(1) | CVCL_9898 | Neuroblastoma | Homo sapiens | |||
| SK-N-RA | CVCL_AQ53 | Neuroblastoma | Homo sapiens | |||
| LA-N-6 | CVCL_1363 | Neuroblastoma | Homo sapiens | |||
| CHLA-136 | CVCL_6590 | Neuroblastoma | Homo sapiens | |||
| CHLA-79 | CVCL_6608 | Neuroblastoma | Homo sapiens | |||
| CHLA-119 | CVCL_A055 | Neuroblastoma | Homo sapiens | |||
| CHLA-90 | CVCL_6610 | Neuroblastoma | Homo sapiens | |||
| CHLA-172 | CVCL_A056 | Neuroblastoma | Homo sapiens | |||
| Experimental
Result(s) |
Combination of vorinostat and flavopiridol is selectively cytotoxic to multidrug-resistant neuroblastoma cell lines with mutant TP53. The combination caused reduction in the expression of G(2)/M proteins (cyclin B1, Mad2, MPM2) in 2 cell lines with mt TP53 but not in those with wt TP53. | |||||
| Mithramycin A | Streptomyces tanashiensis | Click to Show/Hide the Molecular Data of This NP | ||||
| Achieving Therapeutic Synergy | Click to Show/Hide | |||||
| Representative Experiment Reporting the Effect of This Combination | [8] | |||||
| Detail(s) |
Combination Info
|
|||||
| In-vitro Model | Primary tumor cells derived from Sezary syndrome patients | Sezary syndrome | Homo sapiens | |||
| Experimental
Result(s) |
MTR, like SAHA, induced the apoptosis of SS cells, while the two drugs in combination showed clear synergy or potentiation. | |||||
| Pterostilbene | Vitis vinifera | Click to Show/Hide the Molecular Data of This NP | ||||
| Achieving Therapeutic Synergy | Click to Show/Hide | |||||
| Representative Experiment Reporting the Effect of This Combination | [9] | |||||
| Detail(s) |
Combination Info
|
|||||
| Molecule(s)
Regulation |
Down-regulation | Expression | HIF-1A | Molecule Info |
Pathway MAP
|
|
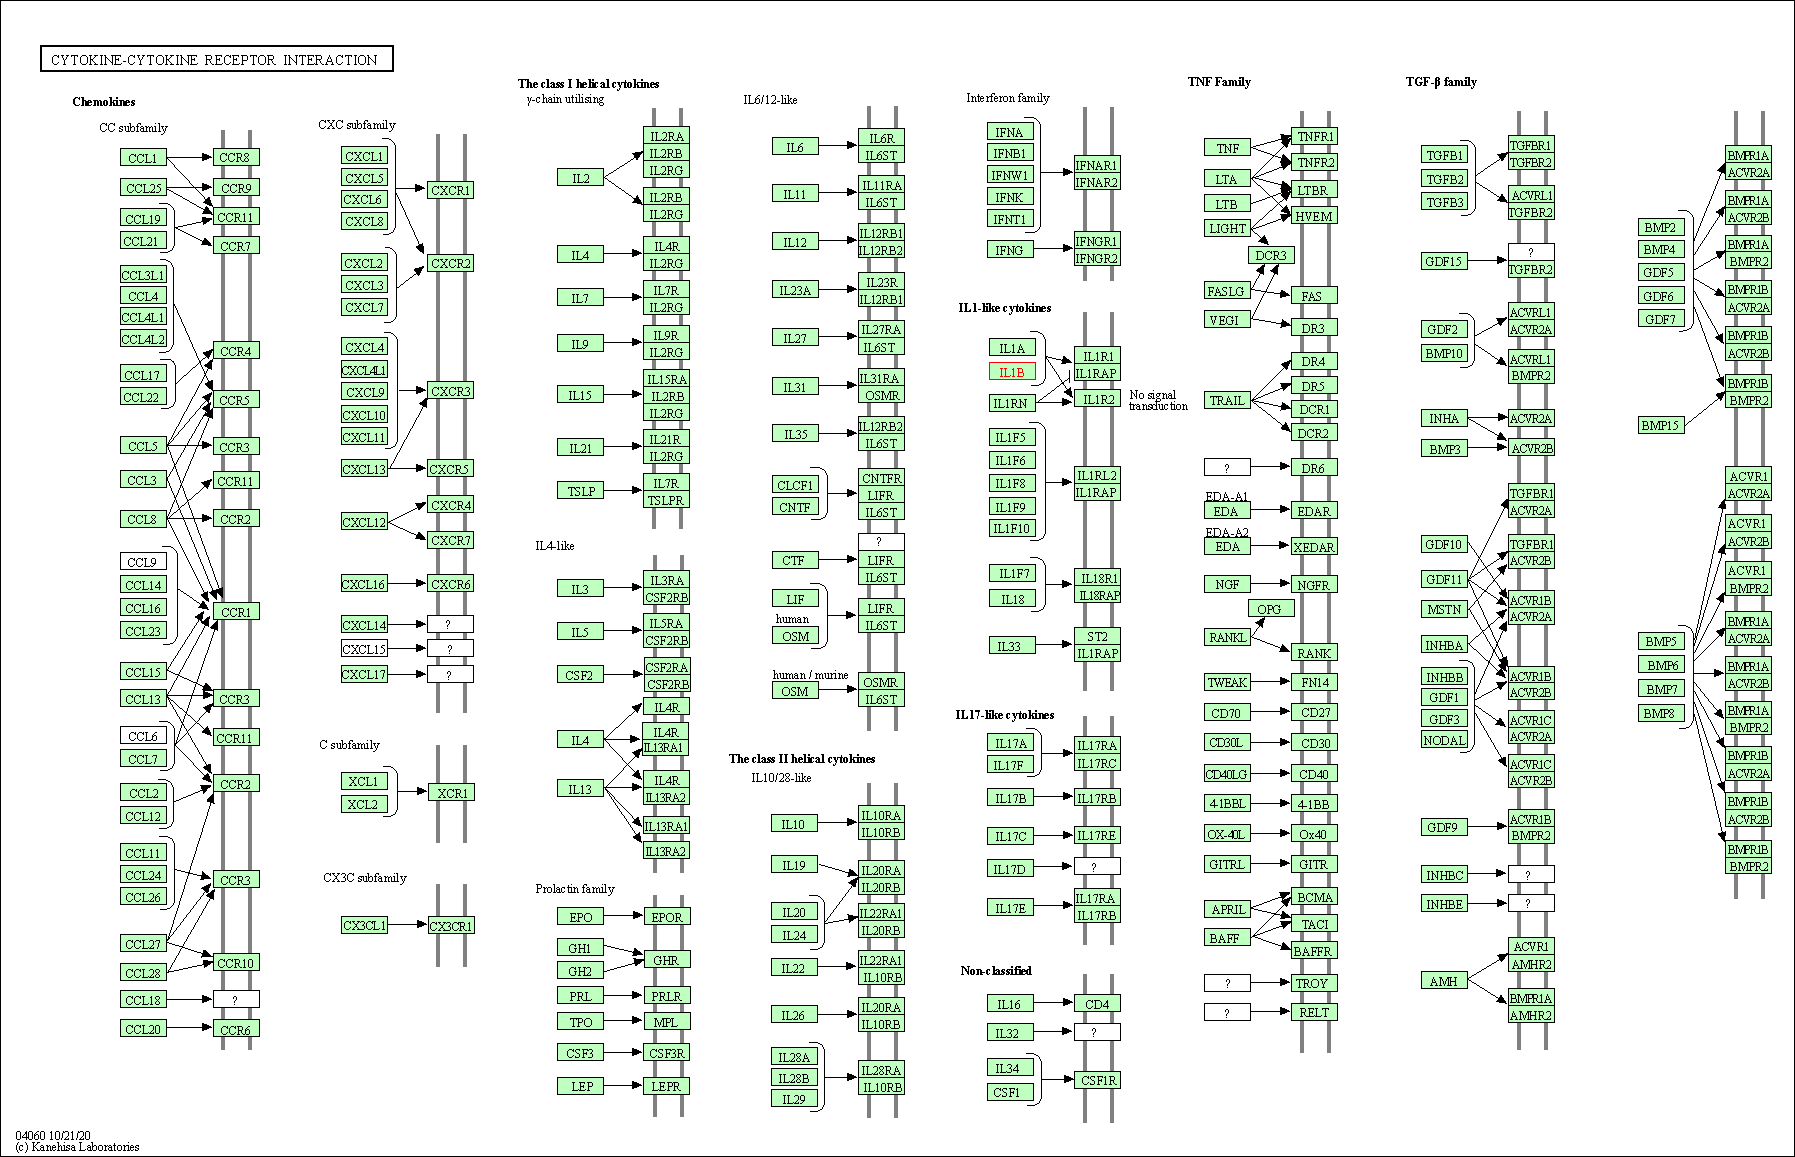
| Down-regulation | Expression | IL1B | Molecule Info |
Pathway MAP
|
||
| Down-regulation | Expression | MTA1 | Molecule Info | |||
| Down-regulation | Expression | VEGFA | Molecule Info |
Pathway MAP
|
||
| In-vitro Model | LNCaP | CVCL_0395 | Prostate carcinoma | Homo sapiens | ||
| In-vivo Model | Female C57BL/6J mouse homozygous with "floxed" allele of Pten gene were used in this study. | |||||
| Experimental
Result(s) |
Pterostilbene sensitized tumor cells to SAHA treatment resulting in inhibiting tumor growth and additional decline of tumor progression. These effects were dependent on the reduction of MTA1-associated proangiogenic factors HIF-1Alpha, VEGF, and IL-1Beta leading to decreased angiogenesis. | |||||
| Silibinin | Carduus marianus | Click to Show/Hide the Molecular Data of This NP | ||||
| Augmenting Drug Sensitivity | Click to Show/Hide | |||||
| Representative Experiment Reporting the Effect of This Combination | [10] | |||||
| Detail(s) |
Combination Info
|
|||||
| Molecule(s)
Regulation |
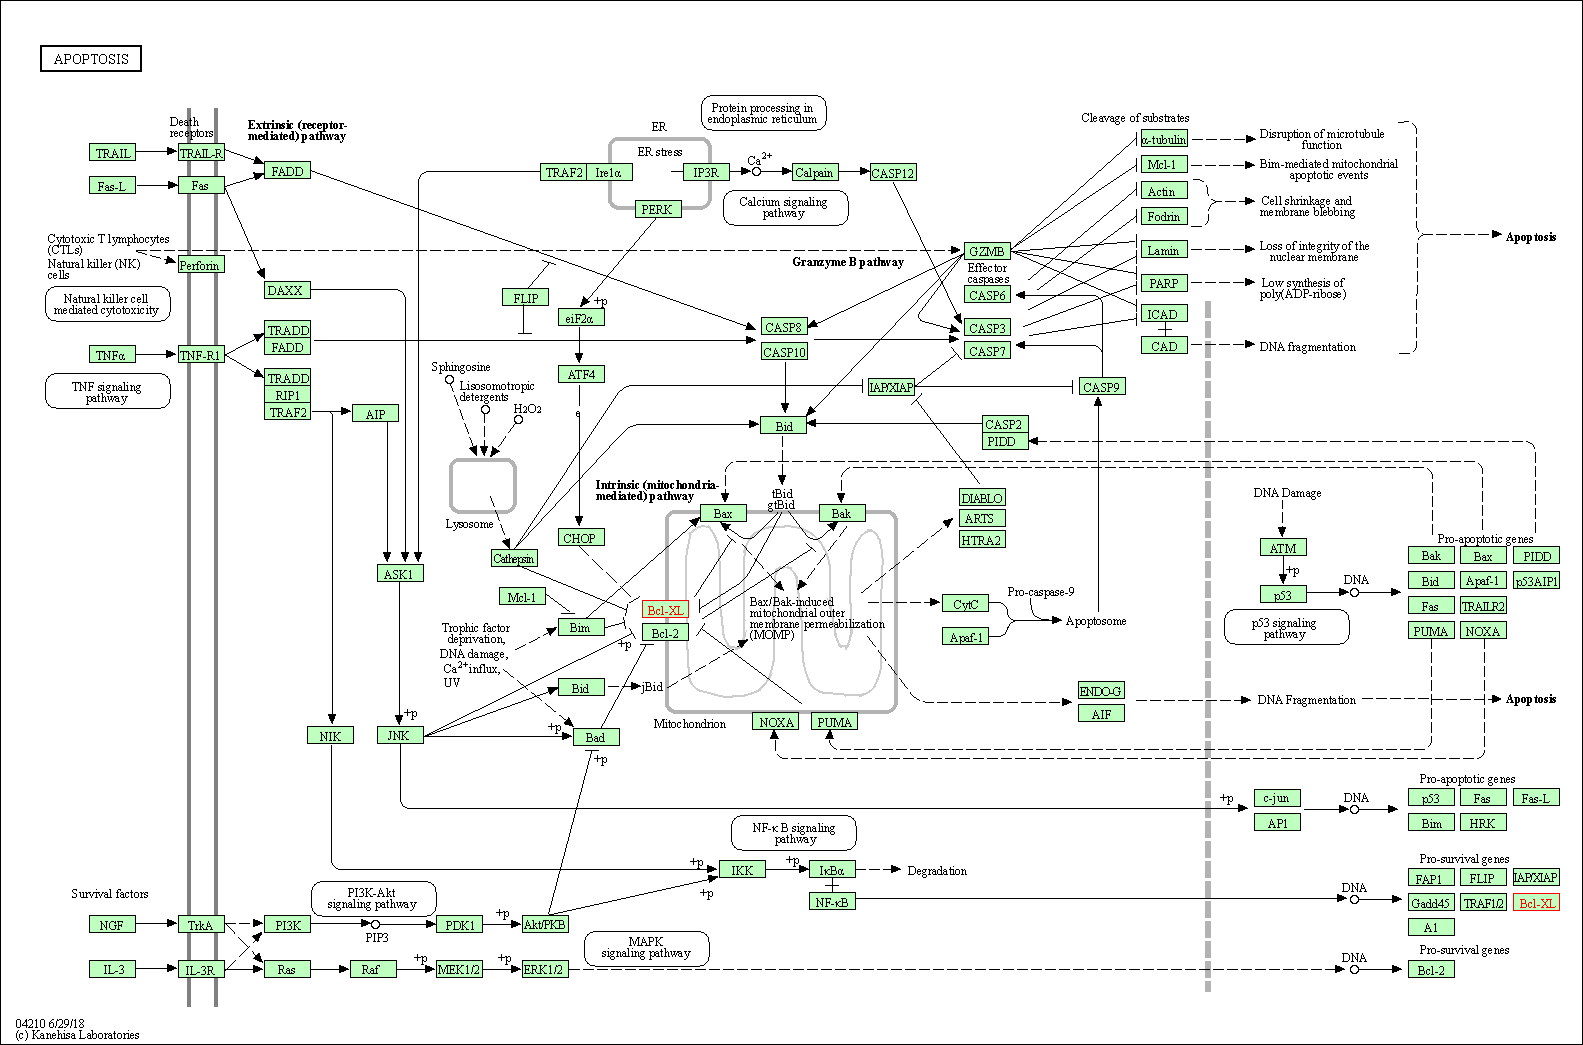
Down-regulation | Expression | BCL-2 | Molecule Info |
Pathway MAP
|
|
| Down-regulation | Expression | BCL-xL | Molecule Info |
Pathway MAP
|
||
| Down-regulation | Expression | BIRC5 | Molecule Info |
Pathway MAP
|
||
| Down-regulation | Expression | CCNB1 | Molecule Info |
Pathway MAP
|
||
| Up-regulation | Expression | CDKN1A | Molecule Info |
Pathway MAP
|
||
| Down-regulation | Expression | MCL1 | Molecule Info |
Pathway MAP
|
||
| Down-regulation | Expression | POLD1 | Molecule Info |
Pathway MAP
|
||
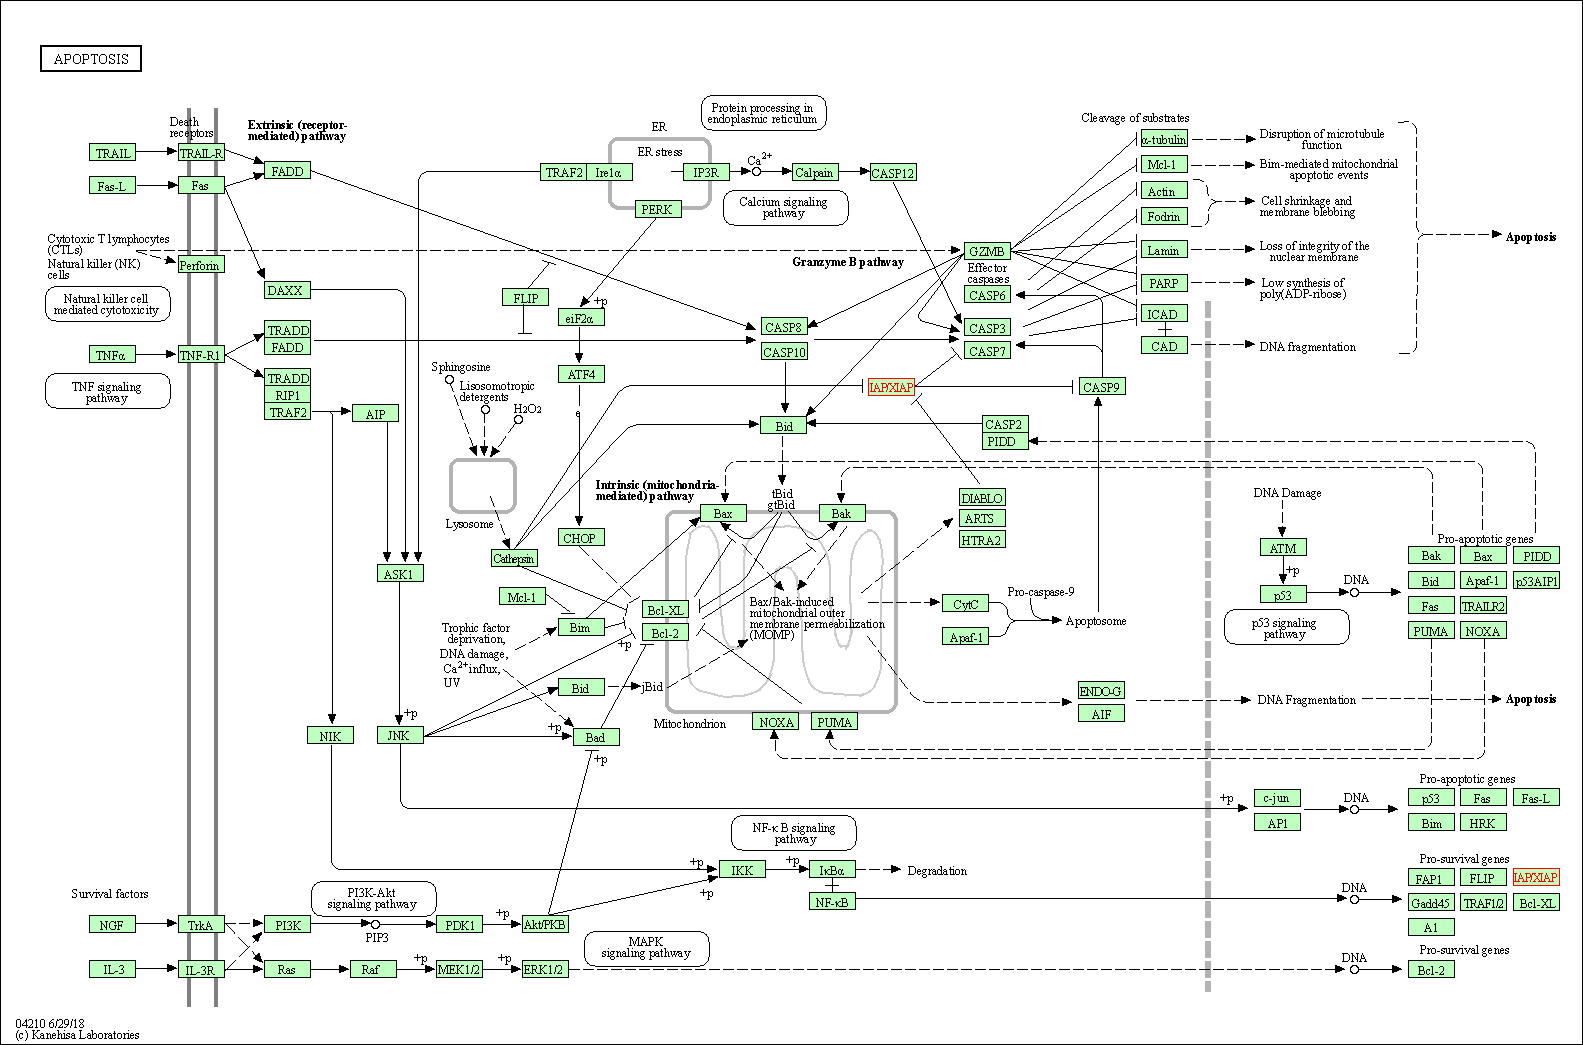
| Down-regulation | Expression | XIAP | Molecule Info |
Pathway MAP
|
||
| Biological
Regulation |
Induction | Cell cycle arrest in G2/M phase | ||||
| In-vitro Model | NCI-H1299 | CVCL_0060 | Lung large cell carcinoma | Homo sapiens | ||
| NCI-H358 | CVCL_1559 | Lung adenocarcinoma | Homo sapiens | |||
| NCI-H322 | CVCL_1556 | Lung adenocarcinoma | Homo sapiens | |||
| In-vivo Model | Six week old athymic (nu/nu) male nude mice were subcutaneously injected with three million exponentially growing H1299 cells mixed with equal volume (1:1) of matrigel on the right flank of each mouse. | |||||
| Experimental
Result(s) |
Combinations of SAHA with silibinin synergistically augmented the cytotoxic effects of the single agent, which was associated with a dramatic increase in p21 (Cdkn1a). | |||||
| Vincristine | Catharanthus roseus | Click to Show/Hide the Molecular Data of This NP | ||||
| Achieving Therapeutic Synergy | Click to Show/Hide | |||||
| Representative Experiment Reporting the Effect of This Combination | [11] | |||||
| Detail(s) |
Combination Info
|
|||||
| Molecule(s)
Regulation |
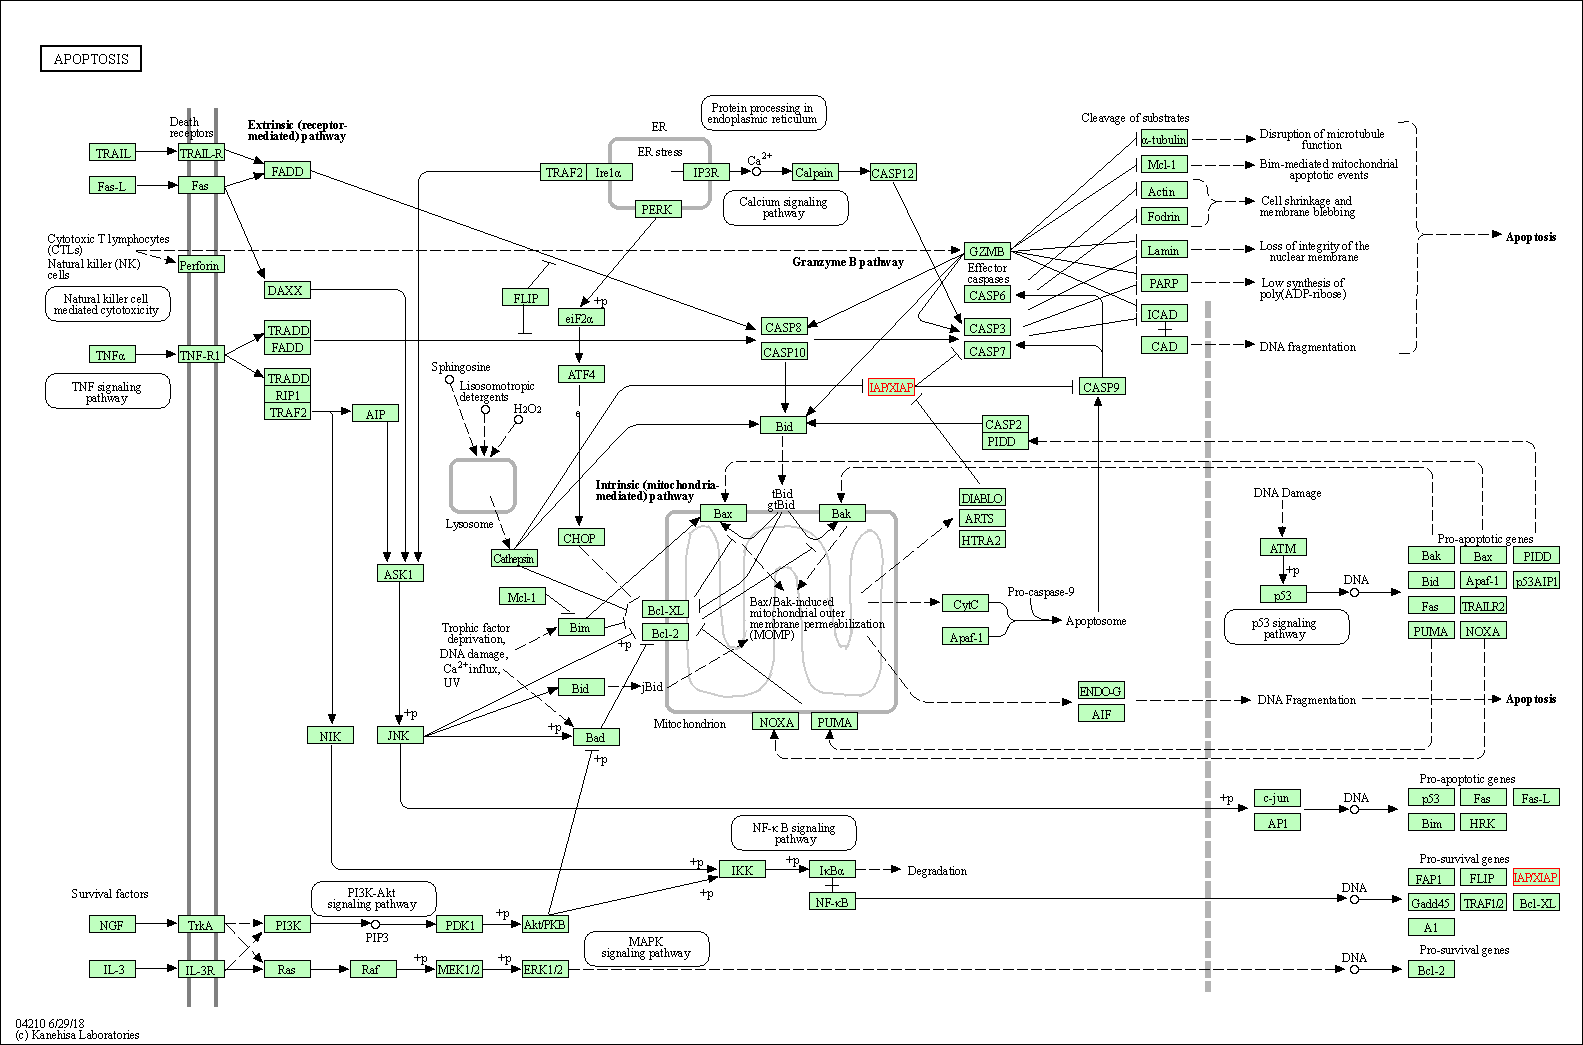
Down-regulation | Expression | BCL-2 | Molecule Info |
Pathway MAP
|
|
| Down-regulation | Expression | BCL-xL | Molecule Info |
Pathway MAP
|
||
| Up-regulation | Expression | CASP3 | Molecule Info |
Pathway MAP
|
||
| Down-regulation | Expression | HDAC6 | Molecule Info |
Pathway MAP
|
||
| Down-regulation | Expression | MCL1 | Molecule Info |
Pathway MAP
|
||
| Up-regulation | Expression | PARP1 | Molecule Info |
Pathway MAP
|
||
| Biological
Regulation |
Induction | Cell cycle arrest in G2/M phase | ||||
| In-vitro Model | MOLT-4 | CVCL_0013 | Adult T acute lymphoblastic leukemia | Homo sapiens | ||
| CCRF-CEM | CVCL_0207 | T acute lymphoblastic leukemia | Homo sapiens | |||
| In-vivo Model | MOLT-4 cells were implanted (1*107 cells/ml) into severe combined immunodeficiency (SCID) mice. | |||||
| Experimental
Result(s) |
The combination of vincristine and SAHA on T cell leukemic cells resulted in a change in microtubule dynamics contributing to M phase arrest followed by induction of the apoptotic pathway. | |||||
| Target and Pathway | ||||
|---|---|---|---|---|
| Target(s) | Histone deacetylase 1 (HDAC1) | Molecule Info | [12] | |
| KEGG Pathway | Cell cycle | Click to Show/Hide | ||
| 2 | Notch signaling pathway | |||
| 3 | Thyroid hormone signaling pathway | |||
| 4 | Huntington's disease | |||
| 5 | Amphetamine addiction | |||
| 6 | Alcoholism | |||
| 7 | Epstein-Barr virus infection | |||
| 8 | Pathways in cancer | |||
| 9 | Transcriptional misregulation in cancer | |||
| 10 | Viral carcinogenesis | |||
| 11 | MicroRNAs in cancer | |||
| 12 | Chronic myeloid leukemia | |||
| NetPath Pathway | TCR Signaling Pathway | Click to Show/Hide | ||
| Panther Pathway | Wnt signaling pathway | Click to Show/Hide | ||
| 2 | p53 pathway | |||
| Pathway Interaction Database | Regulation of nuclear SMAD2/3 signaling | Click to Show/Hide | ||
| 2 | Notch signaling pathway | |||
| 3 | E2F transcription factor network | |||
| 4 | Presenilin action in Notch and Wnt signaling | |||
| 5 | Signaling events mediated by HDAC Class I | |||
| 6 | Regulation of Telomerase | |||
| 7 | Glucocorticoid receptor regulatory network | |||
| 8 | Sumoylation by RanBP2 regulates transcriptional repression | |||
| 9 | Regulation of Androgen receptor activity | |||
| 10 | IL3-mediated signaling events | |||
| 11 | Validated nuclear estrogen receptor alpha network | |||
| 12 | Retinoic acid receptors-mediated signaling | |||
| 13 | Hedgehog signaling events mediated by Gli proteins | |||
| 14 | Regulation of nuclear beta catenin signaling and target gene transcription | |||
| 15 | Validated targets of C-MYC transcriptional repression | |||
| 16 | Regulation of retinoblastoma protein | |||
| 17 | Notch-mediated HES/HEY network | |||
| Reactome | G0 and Early G1 | Click to Show/Hide | ||
| 2 | p75NTR negatively regulates cell cycle via SC1 | |||
| 3 | Formation of the beta-catenin:TCF transactivating complex | |||
| 4 | NOTCH1 Intracellular Domain Regulates Transcription | |||
| 5 | SMAD2/SMAD3:SMAD4 heterotrimer regulates transcription | |||
| 6 | Constitutive Signaling by NOTCH1 PEST Domain Mutants | |||
| 7 | Constitutive Signaling by NOTCH1 HD+PEST Domain Mutants | |||
| 8 | HDACs deacetylate histones | |||
| 9 | Deactivation of the beta-catenin transactivating complex | |||
| 10 | NoRC negatively regulates rRNA expression | |||
| 11 | RNA Polymerase I Transcription Initiation | |||
| 12 | Factors involved in megakaryocyte development and platelet production | |||
| WikiPathways | SIDS Susceptibility Pathways | Click to Show/Hide | ||
| 2 | Notch Signaling Pathway | |||
| 3 | TGF beta Signaling Pathway | |||
| 4 | IL-6 signaling pathway | |||
| 5 | Apoptosis-related network due to altered Notch3 in ovarian cancer | |||
| 6 | Transcriptional activity of SMAD2/SMAD3:SMAD4 heterotrimer | |||
| 7 | Notch Signaling Pathway | |||
| 8 | Retinoblastoma (RB) in Cancer | |||
| 9 | Neural Crest Differentiation | |||
| 10 | TWEAK Signaling Pathway | |||
| 11 | Integrated Breast Cancer Pathway | |||
| 12 | Signalling by NGF | |||
| 13 | RNA Polymerase I, RNA Polymerase III, and Mitochondrial Transcription | |||
| 14 | Mitotic G1-G1/S phases | |||
| 15 | Factors involved in megakaryocyte development and platelet production | |||
| 16 | Cell Cycle | |||
| 17 | Androgen receptor signaling pathway | |||