Natural Product (NP) Details
| General Information of the NP (ID: NP2960) | |||||
|---|---|---|---|---|---|
| Name |
Epigallocatechin gallate
|
||||
| Synonyms |
(-)-Epigallocatechin gallate; EGCG; 989-51-5; Epigallocatechin 3-gallate; Epigallocatechin-3-gallate; Tea catechin; (-)-Epigallocatechin-3-o-gallate; Teavigo; Epigallocatechin-3-monogallate; (-)-Epigallocatechol gallate; (2R,3R)-5,7-Dihydroxy-2-(3,4,5-trihydroxyphenyl)chroman-3-yl 3,4,5-trihydroxybenzoate; Catechin deriv; UNII-BQM438CTEL; Green tea extract; CCRIS 3729; (-)-epigallocatechin 3-gallate; C22H18O11; BQM438CTEL; (2R,3R)-5,7-dihydroxy-2-(3,4,5-trihydroxyphenyl)-3,4-dihydro-2H-chromen-3-yl; EGCG analogs; EGCG, Anagen; Epigallocatechin gallate analogs, Anagen; Epigallocatechin gallate, Anagen; GTPs,Anagen; Green tea polyphenols, Anagen; EPIGALOCATECHIN GALLATE
Click to Show/Hide
|
||||
| Species Origin | Hamamelis virginiana ... | Click to Show/Hide | |||
| Hamamelis virginiana | |||||
| Disease | Hepatic fibrosis/cirrhosis [ICD-11: DB93] | Phase 3 | [1] | ||
| Discovery agent [ICD-11: N.A.] | Investigative | [2] | |||
| Structure |

|
Click to Download Mol2D MOL |
|||
| ADMET Property |
Absporption
Caco-2 Permeability
-6.894
MDCK Permeability
-4.891
PAMPA
+
HIA
- - -
Distribution
VDss
-0.293
PPB
87.3%
BBB
- - -
Metabolism
CYP1A2 inhibitor
- - -
CYP1A2 substrate
- - -
CYP2C19 inhibitor
- - -
CYP2C19 substrate
- - -
CYP2C9 inhibitor
- -
CYP2C9 substrate
- - -
CYP2D6 inhibitor
- - -
CYP2D6 substrate
- - -
CYP3A4 inhibitor
- - -
CYP3A4 substrate
- - -
CYP2B6 inhibitor
+++
CYP2B6 substrate
- - -
CYP2C8 inhibitor
+++
HLM Stability
- - -
Excretion
CLplasma
8.232
T1/2
2.325
Toxicity
DILI
+++
Rat Oral Acute Toxicity
+
FDAMDD
+++
Respiratory
+
Human Hepatotoxicity
- -
Ototoxicity
+++
Drug-induced Nephrotoxicity
- - -
Drug-induced Neurotoxicity
- - -
Hematotoxicity
- - -
Genotoxicity
+++
Tips: 1. For the classification endpoints, the prediction probability values are transformed into six symbols: 0-0.1 (- - -), 0.1-0.3 (- -), 0.3-0.5 (-), 0.5-0.7 (+), 0.7-0.9 (++), and 0.9-1.0 (+++).
2. Additionally, the corresponding relationships of the three labels are as follows: excellent; medium; poor.
Click to Show/Hide
|
||||
| Click to Show/Hide the Molecular Information and External Link(s) of This Natural Product | |||||
| Formula |
C22H18O11
|
||||
| PubChem CID | |||||
| Canonical SMILES |
C1C(C(OC2=CC(=CC(=C21)O)O)C3=CC(=C(C(=C3)O)O)O)OC(=O)C4=CC(=C(C(=C4)O)O)O
|
||||
| InChI |
1S/C22H18O11/c23-10-5-12(24)11-7-18(33-22(31)9-3-15(27)20(30)16(28)4-9)21(32-17(11)6-10)8-1-13(25)19(29)14(26)2-8/h1-6,18,21,23-30H,7H2/t18-,21-/m1/s1
|
||||
| InChIKey |
WMBWREPUVVBILR-WIYYLYMNSA-N
|
||||
| CAS Number |
CAS 989-51-5
|
||||
| Herb ID | |||||
| TTD Drug ID | |||||
| Combinatorial Therapeutic Effect(s) Validated Clinically or Experimentally | ||||||
|---|---|---|---|---|---|---|
| α. A List of Drug(s) Whose Efficacy can be Enhanced by This NP | ||||||
| Interferon alpha-2b | Acute lymphoblastic leukemia | Click to Show/Hide the Molecular Data of This Drug | ||||
| Augmenting Drug Sensitivity | Click to Show/Hide | |||||
| Representative Experiment Reporting the Effect of This Combination | [3] | |||||
| Detail(s) |
Combination Info
|
|||||
| Molecule(s)
Regulation |
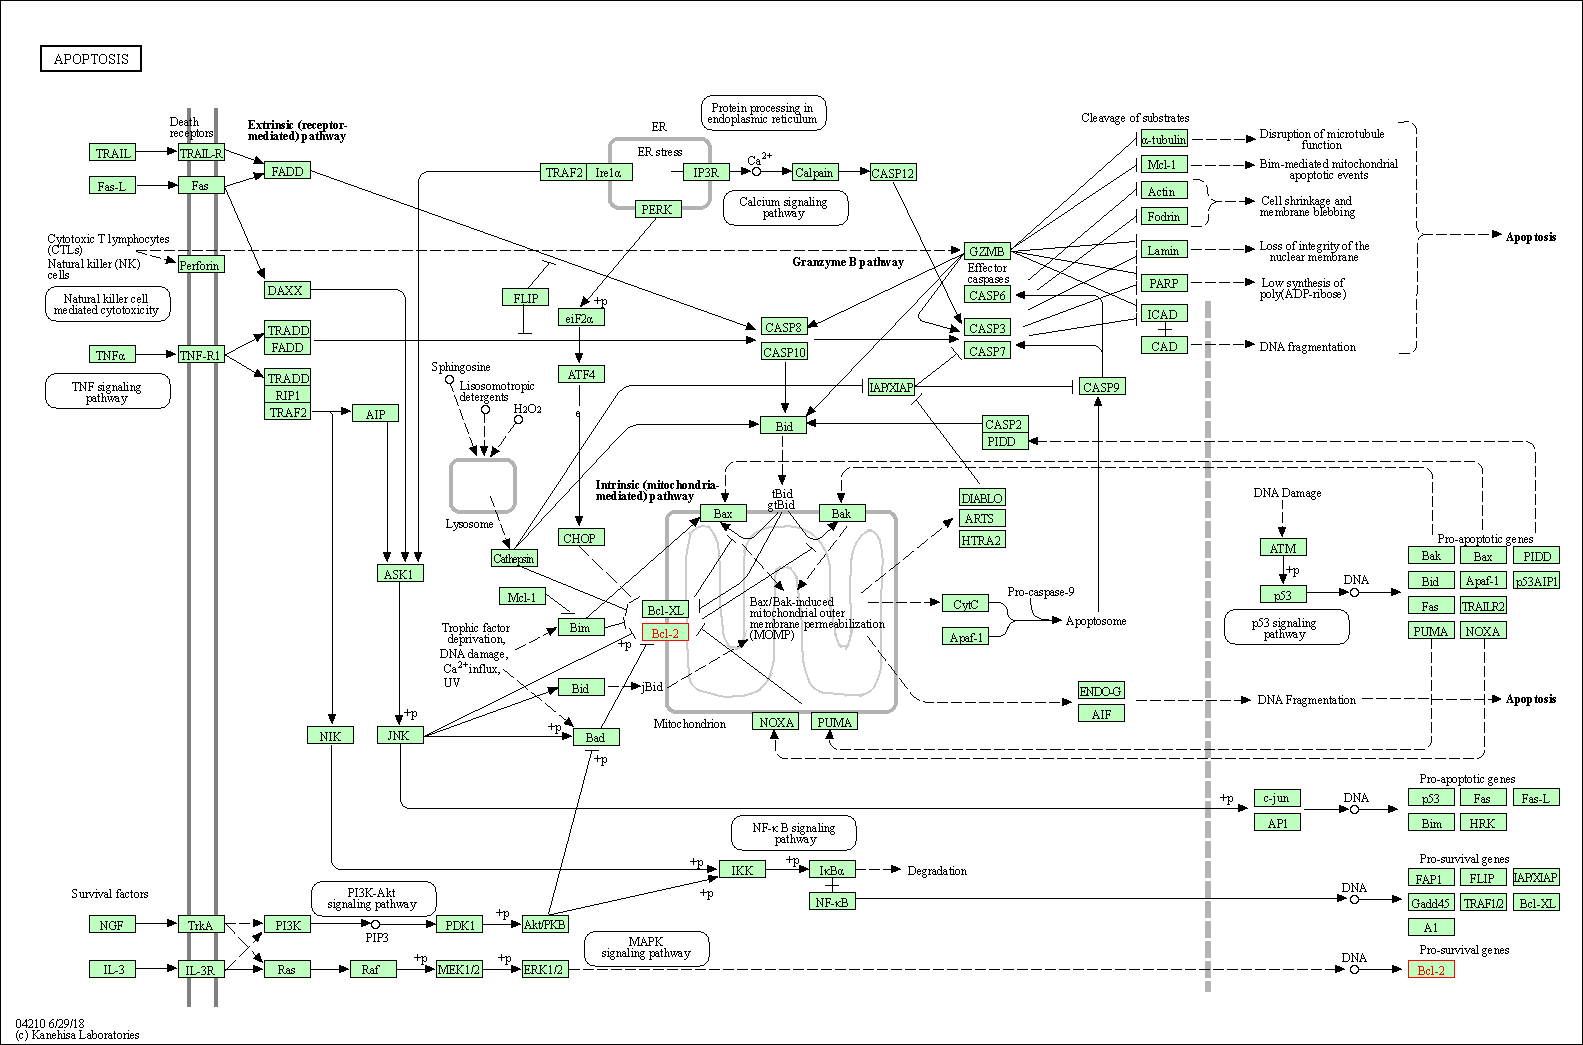
Up-regulation | Expression | FAS | Molecule Info |
Pathway MAP
|
|
| Down-regulation | Expression | p105 | Molecule Info |
Pathway MAP
|
||
| In-vitro Model | A-375 | CVCL_0132 | Amelanotic melanoma | Homo sapiens | ||
| G-361 | CVCL_1220 | Melanoma | Homo sapiens | |||
| Hs 294T | CVCL_0331 | Melanoma | Homo sapiens | |||
| In-vivo Model | Female nu/nu athymic nude mice (6-weeks old) were subcutaneously implanted with 0.5*106 Hs-294T melanoma cells with equal volume of matrigel (in 100L) on the left flanks. | |||||
| Experimental
Result(s) |
EGCG sensitizes melanoma cells to interferon induced growth inhibition in a mouse model of human melanoma. | |||||
| Sodium butyrate | Acute myeloid leukemia | Click to Show/Hide the Molecular Data of This Drug | ||||
| Augmenting Drug Sensitivity | Click to Show/Hide | |||||
| Representative Experiment Reporting the Effect of This Combination | [4] | |||||
| Detail(s) |
Combination Info
|
|||||
| Molecule(s)
Regulation |
Down-regulation | Expression | BIRC5 | Molecule Info |
Pathway MAP
|
|
| Up-regulation | Expression | CDKN1A | Molecule Info |
Pathway MAP
|
||
| Down-regulation | Expression | DNMT1 | Molecule Info |
Pathway MAP
|
||
| Down-regulation | Expression | HDAC1 | Molecule Info |
Pathway MAP
|
||
| Up-regulation | Expression | p105 | Molecule Info |
Pathway MAP
|
||
| Up-regulation | Expression | TP53 | Molecule Info |
Pathway MAP
|
||
| Biological
Regulation |
Induction | Cell cycle arrest in G2/M phase | ||||
| In-vitro Model | RKO | CVCL_0504 | Colon carcinoma | Homo sapiens | ||
| HCT 116 | CVCL_0291 | Colon carcinoma | Homo sapiens | |||
| HT-29 | CVCL_0320 | Colon adenocarcinoma | Homo sapiens | |||
| Experimental
Result(s) |
At low and physiologically achievable concentrations, combinatorial EGCG and NaB are effective in promoting apoptosis, inducing cell cycle arrest and DNA-damage in CRC cells. | |||||
| Temozolomide | Brain cancer | Click to Show/Hide the Molecular Data of This Drug | ||||
| Augmenting Drug Sensitivity | Click to Show/Hide | |||||
| Representative Experiment Reporting the Effect of This Combination | [5] | |||||
| Detail(s) |
Combination Info
|
|||||
| Molecule(s)
Regulation |
Down-regulation | Expression | HSPA5 | Molecule Info |
Pathway MAP
|
|
| In-vitro Model | U-87MG ATCC | CVCL_0022 | Glioblastoma | Homo sapiens | ||
| U-251MG | CVCL_0021 | Astrocytoma | Homo sapiens | |||
| LN-229 | CVCL_0393 | Glioblastoma | Homo sapiens | |||
| In-vivo Model | 2*105 cells (U87 and U251) in a volume of 10L were injected into the right frontal lobe of the brain and thereafter the skin incision was sutured with silk thread in athymic mice. | |||||
| Experimental
Result(s) |
Green tea epigallocatechin gallate enhances therapeutic efficacy of temozolomide in orthotopic mouse glioblastoma models. | |||||
| 6-OH-11-O-Hydroxyphenanthrene | Breast cancer | Click to Show/Hide the Molecular Data of This Drug | ||||
| Augmenting Drug Sensitivity | Click to Show/Hide | |||||
| Representative Experiment Reporting the Effect of This Combination | [6] | |||||
| Detail(s) |
Combination Info
|
|||||
| Molecule(s)
Regulation |
Down-regulation | Expression | COX-2 | Molecule Info |
Pathway MAP
|
|
| Down-regulation | Expression | MMP-2 | Molecule Info |
Pathway MAP
|
||
| Down-regulation | Expression | MMP-9 | Molecule Info |
Pathway MAP
|
||
| Down-regulation | Expression | MYCN | Molecule Info |
Pathway MAP
|
||
| In-vitro Model | SK-N-BE(2)-C | CVCL_0529 | Neuroblastoma | Homo sapiens | ||
| Experimental
Result(s) |
Epigallocatechin-3-gallate and 6-OH-11-O-hydroxyphenanthrene limit BE(2)-C neuroblastoma cell growth and neurosphere formation in vitro. | |||||
| Tamoxifen | Breast cancer | Click to Show/Hide the Molecular Data of This Drug | ||||
| Achieving Therapeutic Synergy | Click to Show/Hide | |||||
| Representative Experiment Reporting the Effect of This Combination | [7] | |||||
| Detail(s) |
Combination Info
|
|||||
| Molecule(s)
Regulation |
Down-regulation | Expression | CYP1B1 | Molecule Info |
Pathway MAP
|
|
| Down-regulation | Expression | EGFR | Molecule Info |
Pathway MAP
|
||
| Down-regulation | Expression | mTOR | Molecule Info |
Pathway MAP
|
||
| In-vitro Model | MDA-MB-231 | CVCL_0062 | Breast adenocarcinoma | Homo sapiens | ||
| MCF-7 | CVCL_0031 | Invasive breast carcinoma | Homo sapiens | |||
| In-vivo Model | Female CD1 athymic nude mice were inoculated into the right flank with MDA-MB-231 cells (2*106/50L matrigel), which were left to form palpable tumours. | |||||
| Experimental
Result(s) |
Tamoxifen at realistic doses (75 mug kg(-1)) can suppress the growth of ER-negative breast cancer when combined with EGCG. The dominant mechanism for tumour suppression is the concomitant decrease in tumour protein expressions of mTOR and the EGFR. | |||||
| N-(4-hydroxyphenyl) retinamide | Cervical cancer | Click to Show/Hide the Molecular Data of This Drug | ||||
| Augmenting Drug Sensitivity | Click to Show/Hide | |||||
| Representative Experiment Reporting the Effect of This Combination | [8] | |||||
| Detail(s) |
Combination Info
|
|||||
| Molecule(s)
Regulation |
Down-regulation | Expression | microRNA 106b | Molecule Info |
Pathway MAP
|
|
| Up-regulation | Expression | microRNA 34a | Molecule Info |
Pathway MAP
|
||
| Up-regulation | Expression | microRNA 7-1 | Molecule Info |
Pathway MAP
|
||
| Down-regulation | Expression | microRNA 92b | Molecule Info |
Pathway MAP
|
||
| Down-regulation | Expression | microRNA 93 | Molecule Info |
Pathway MAP
|
||
| Up-regulation | Expression | microRNA 99a | Molecule Info |
Pathway MAP
|
||
| In-vitro Model | SK-N-BE(2) | CVCL_0528 | Neuroblastoma | Homo sapiens | ||
| IMR-32 | CVCL_0346 | Neuroblastoma | Homo sapiens | |||
| Experimental
Result(s) |
Alterations in expression of specific microRNAs by combination of 4-HPR and EGCG inhibited growth of human malignant neuroblastoma cells. | |||||
| Erlotinib | Lung cancer | Click to Show/Hide the Molecular Data of This Drug | ||||
| Achieving Therapeutic Synergy | Click to Show/Hide | |||||
| Representative Experiment Reporting the Effect of This Combination | [9] | |||||
| Detail(s) |
Combination Info
|
|||||
| Molecule(s)
Regulation |
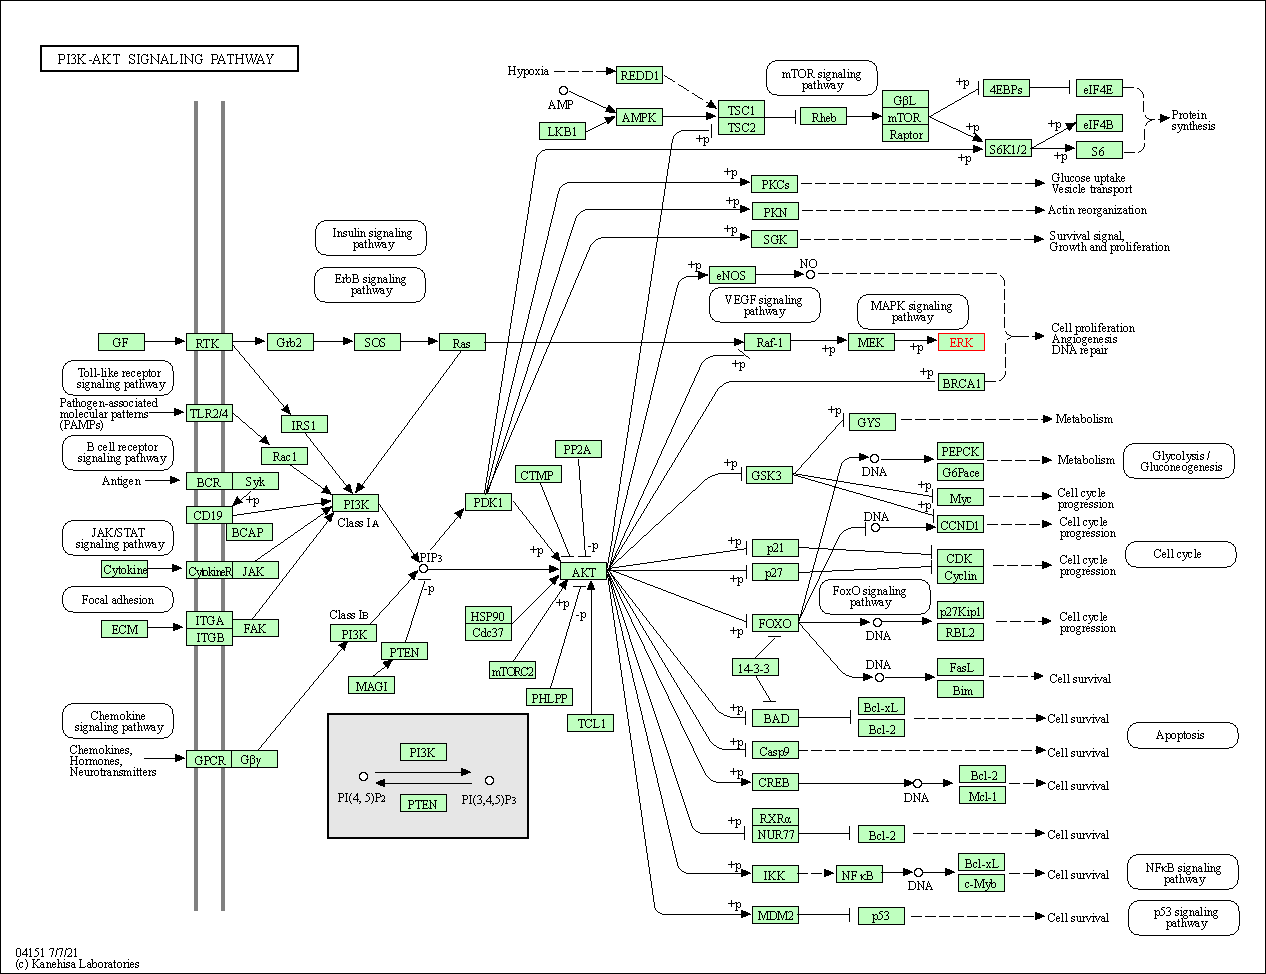
Down-regulation | Phosphorylation | AKT1 | Molecule Info |
Pathway MAP
|
|
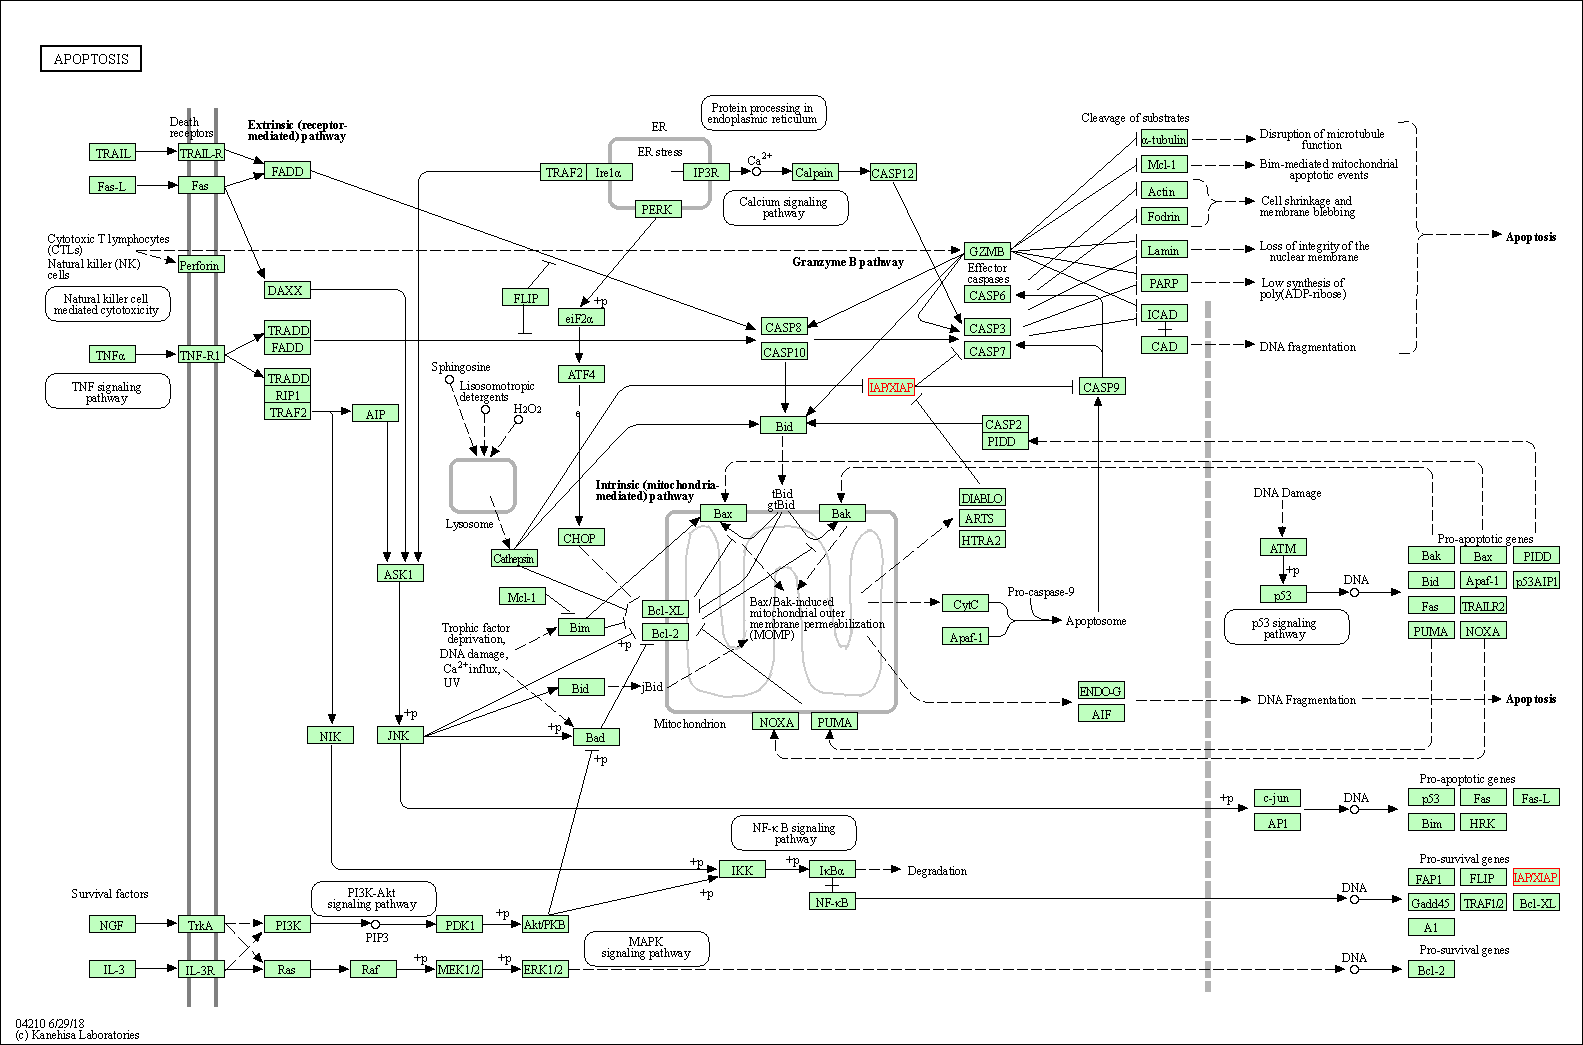
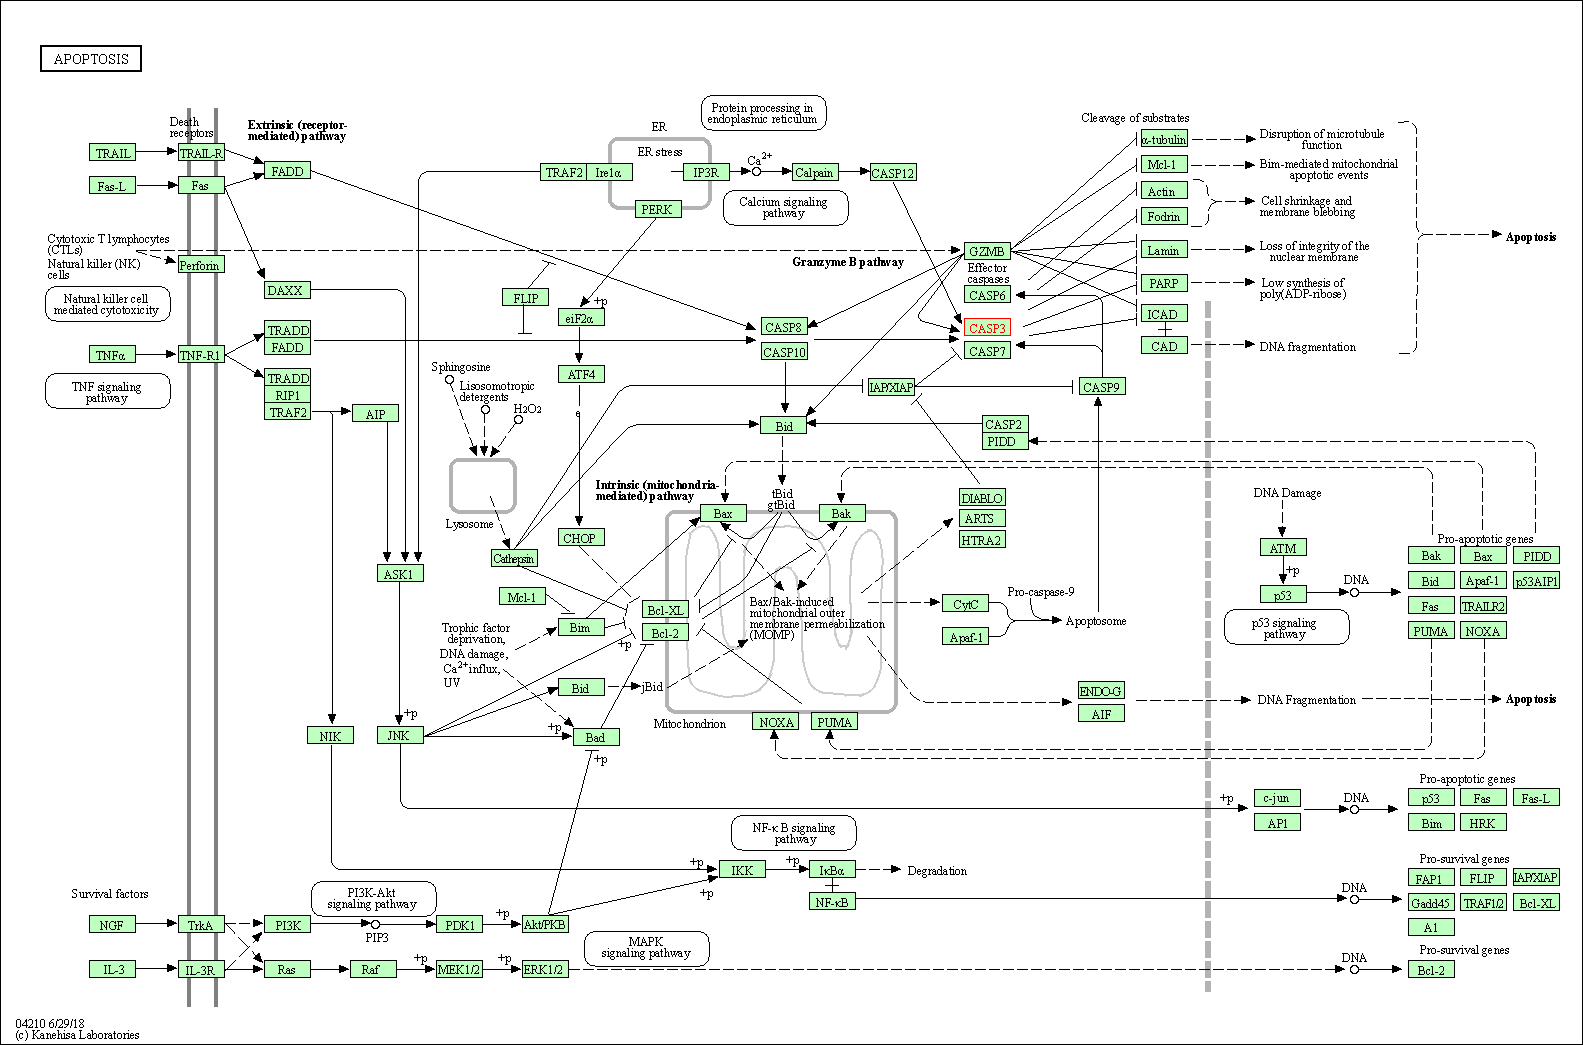
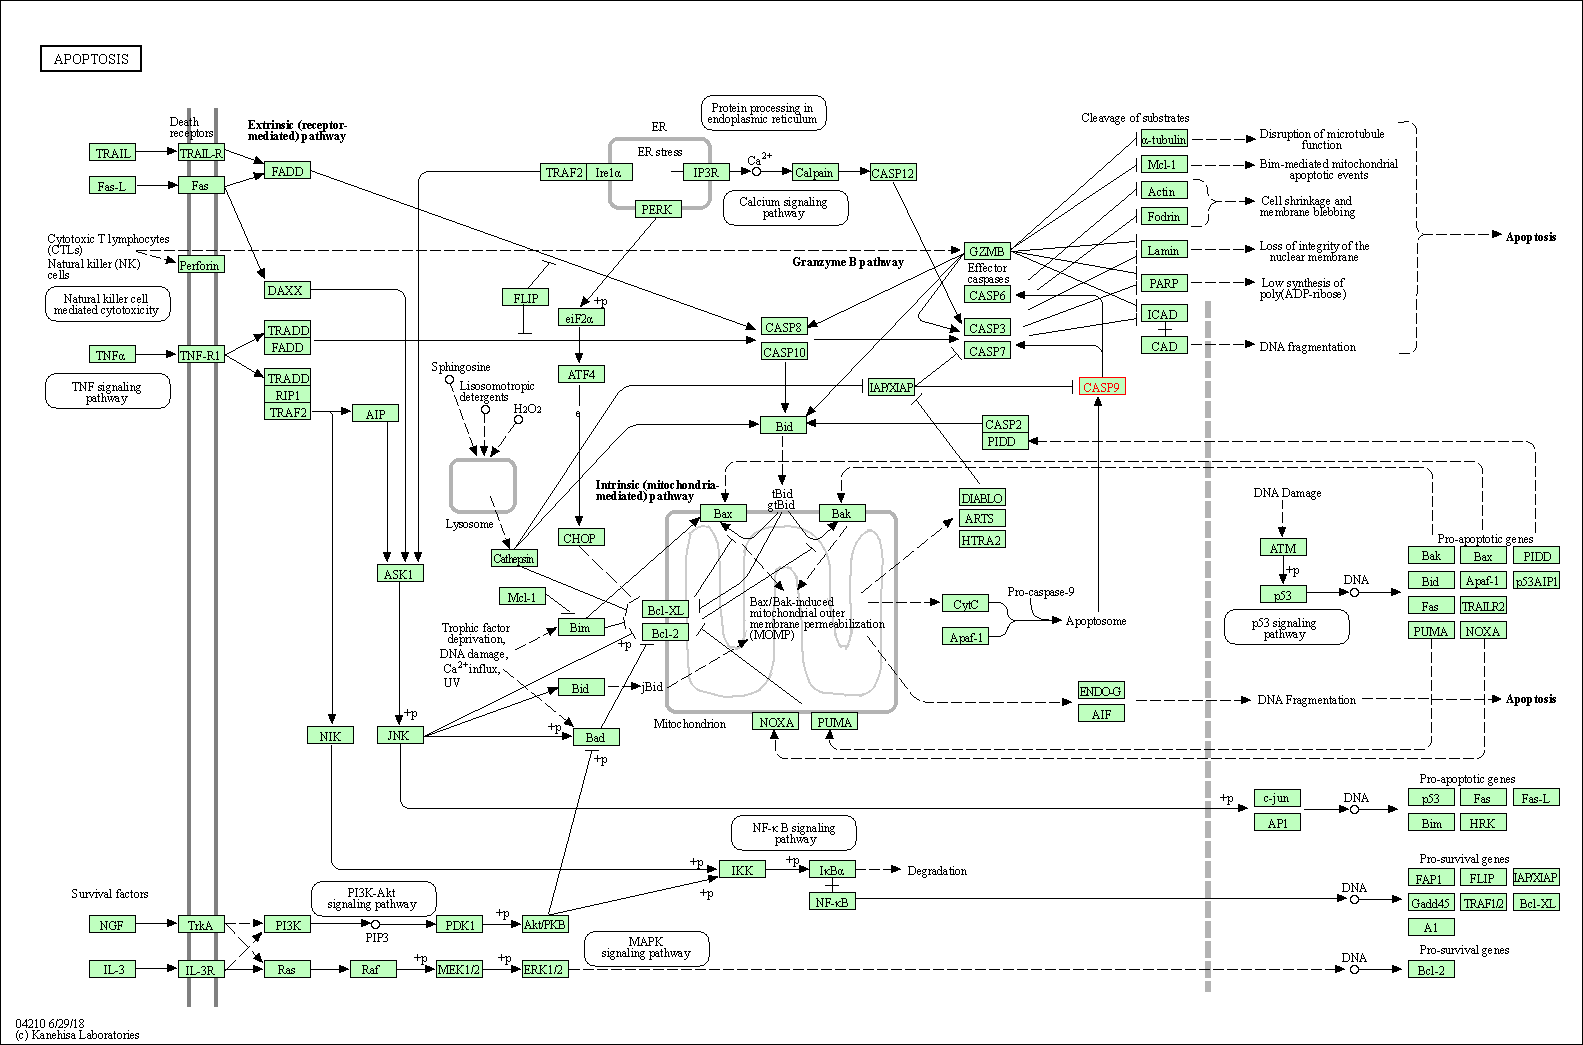
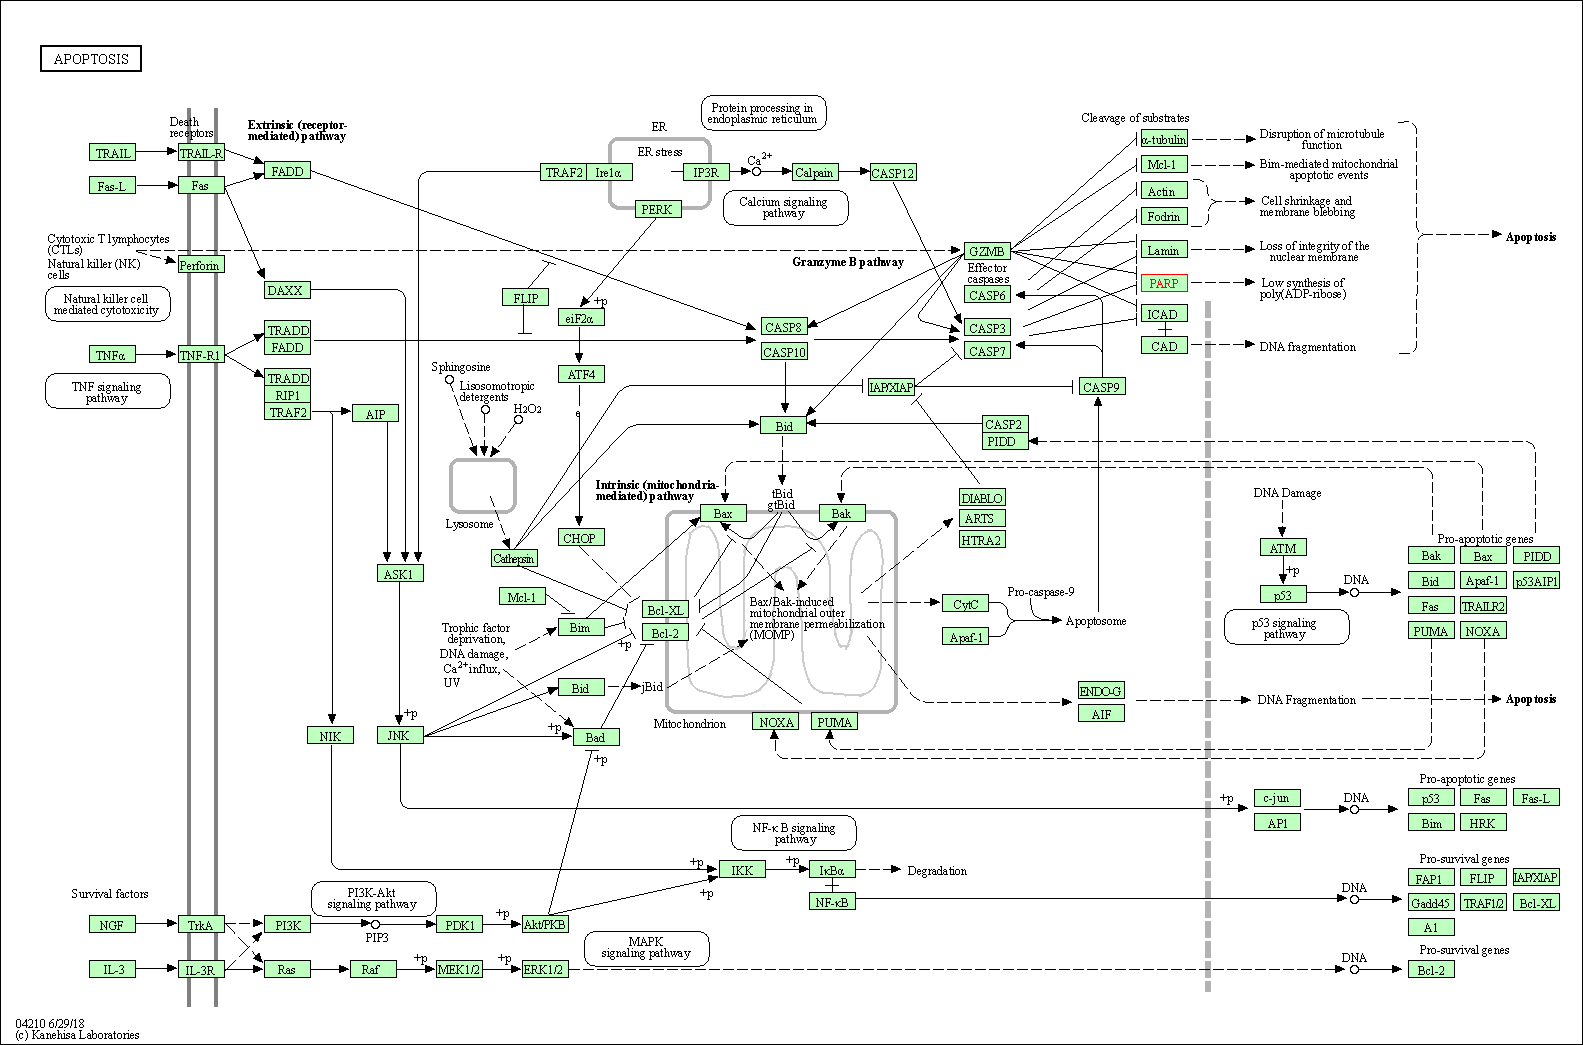
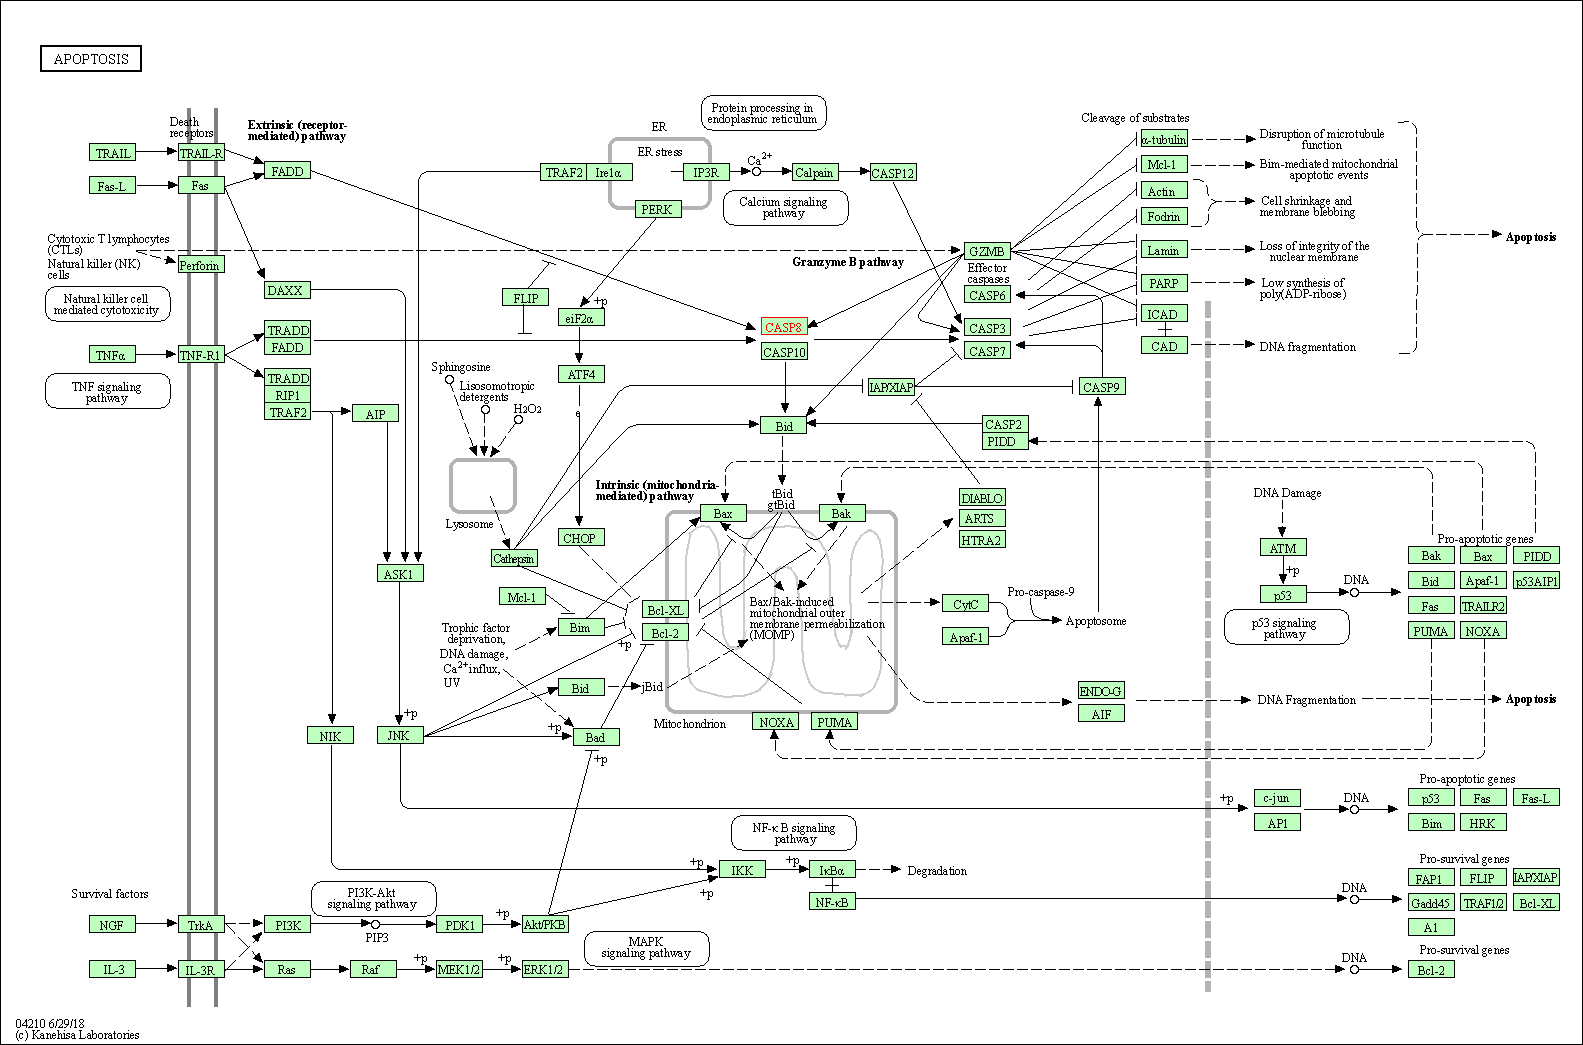
| Up-regulation | Cleavage | CASP3 | Molecule Info |
Pathway MAP
|
||
| Up-regulation | Cleavage | CASP9 | Molecule Info |
Pathway MAP
|
||
| Down-regulation | Phosphorylation | EGFR | Molecule Info |
Pathway MAP
|
||
| Down-regulation | Phosphorylation | ERK1 | Molecule Info |
Pathway MAP
|
||
| Up-regulation | Cleavage | PARP1 | Molecule Info |
Pathway MAP
|
||
| In-vitro Model | Tu 177 | CVCL_4913 | Laryngeal squamous cell carcinoma | Homo sapiens | ||
| Tu 212 | CVCL_4915 | Head and neck squamous cell carcinoma | Homo sapiens | |||
| MDA-886Ln | CVCL_6987 | Laryngeal squamous cell carcinoma | Homo sapiens | |||
| SqCC/Y1 | CVCL_0551 | Oral cavity squamous cell carcinoma | Homo sapiens | |||
| In-vivo Model | Animal models were constructed by injecting Tu212 cells (2*106) into the right flank of nude mice (athymic nu/nu). | |||||
| Experimental
Result(s) |
The combined treatment resulted in significantly greater inhibition of tumor growth and delayed tumor progression as a result of increased apoptosis, decreased cell proliferation and reduced pEGFR and pAKT compared to the single agent treatment groups. | |||||
| Leptomycin B | Lung cancer | Click to Show/Hide the Molecular Data of This Drug | ||||
| Augmenting Drug Sensitivity | Click to Show/Hide | |||||
| Representative Experiment Reporting the Effect of This Combination | [10] | |||||
| Detail(s) |
Combination Info
|
|||||
| Molecule(s)
Regulation |
Down-regulation | Expression | BIRC5 | Molecule Info |
Pathway MAP
|
|
| Up-regulation | Expression | CDKN1A | Molecule Info |
Pathway MAP
|
||
| Down-regulation | Expression | CYP3A43 | Molecule Info |
Pathway MAP
|
||
| Down-regulation | Expression | GPX1 | Molecule Info |
Pathway MAP
|
||
| Down-regulation | Expression | SOD Cu-Zn | Molecule Info |
Pathway MAP
|
||
| Biological
Regulation |
Up-regulation | ROS generation | ||||
| In-vitro Model | A-549 | CVCL_0023 | Lung adenocarcinoma | Homo sapiens | ||
| Experimental
Result(s) |
Combination treatment of LMB and EGCG augments LMB-induced cytotoxicity through enhanced ROS production and the modulation of drug metabolism and p21/survivin pathways. | |||||
| TNF-related apoptosis inducing ligand | Lung cancer | Click to Show/Hide the Molecular Data of This Drug | ||||
| Augmenting Drug Sensitivity | Click to Show/Hide | |||||
| Representative Experiment Reporting the Effect of This Combination | [11] | |||||
| Detail(s) |
Combination Info
|
|||||
| Molecule(s)
Regulation |
Down-regulation | Expression | PEA15 | Molecule Info | ||
| In-vitro Model | U-87MG ATCC | CVCL_0022 | Glioblastoma | Homo sapiens | ||
| A-172 | CVCL_0131 | Glioblastoma | Homo sapiens | |||
| U-251MG | CVCL_0021 | Astrocytoma | Homo sapiens | |||
| Experimental
Result(s) |
Epigalocatechin-3-gallate (EGCG) downregulates PEA15 and thereby augments TRAIL-mediated apoptosis in malignant glioma. | |||||
| Bortezomib | Mantle cell lymphoma | Click to Show/Hide the Molecular Data of This Drug | ||||
| Augmenting Drug Sensitivity | Click to Show/Hide | |||||
| Representative Experiment Reporting the Effect of This Combination | [12] | |||||
| Detail(s) |
Combination Info
|
|||||
| Molecule(s)
Regulation |
Up-regulation | Cleavage | CASP3 | Molecule Info |
Pathway MAP
|
|
| Up-regulation | Cleavage | CASP8 | Molecule Info |
Pathway MAP
|
||
| Up-regulation | Cleavage | CASP9 | Molecule Info |
Pathway MAP
|
||
| Down-regulation | Phosphorylation | NFKBIA | Molecule Info |
Pathway MAP
|
||
| Up-regulation | Cleavage | PARP1 | Molecule Info |
Pathway MAP
|
||
| Down-regulation | Expression and phosphorylation | RELA | Molecule Info |
Pathway MAP
|
||
| In-vitro Model | KM-3 | CVCL_0011 | Multiple myeloma | Homo sapiens | ||
| Experimental
Result(s) |
Combined EGCG and bortezomib showed synergistic anticancer effect partly via regulating NF-kappaB pathway. | |||||
| Ponatinib | Mantle cell lymphoma | Click to Show/Hide the Molecular Data of This Drug | ||||
| Achieving Therapeutic Synergy | Click to Show/Hide | |||||
| Representative Experiment Reporting the Effect of This Combination | [13] | |||||
| Detail(s) |
Combination Info
|
|||||
| Molecule(s)
Regulation |
Down-regulation | Expression | CCND1 | Molecule Info |
Pathway MAP
|
|
| Down-regulation | Expression | MPIP1 | Molecule Info |
Pathway MAP
|
||
| Up-regulation | Expression | TGFB2 | Molecule Info |
Pathway MAP
|
||
| In-vitro Model | K-562 | CVCL_0004 | Chronic myelogenous leukemia | Homo sapiens | ||
| Experimental
Result(s) |
Synergistic effect of ponatinib and epigallocatechin-3-gallate induces apoptosis in chronic myeloid leukemia cells through altering expressions of cell cycle regulatory genes. | |||||
| Dacarbazine | Melanoma | Click to Show/Hide the Molecular Data of This Drug | ||||
| Augmenting Drug Sensitivity | Click to Show/Hide | |||||
| Representative Experiment Reporting the Effect of This Combination | [14] | |||||
| Detail(s) |
Combination Info
|
|||||
| Molecule(s)
Regulation |
Down-regulation | Phosphorylation | FAK | Molecule Info |
Pathway MAP
|
|
| Down-regulation | Phosphorylation | MMP-9 | Molecule Info |
Pathway MAP
|
||
| In-vitro Model | B16 | CVCL_F936 | Mouse melanoma | Mus musculus | ||
| In-vivo Model | Animal models were constructed by injecting intraperitoneally B16-F3m cells (2*106) into Balb/c mice. | |||||
| Experimental
Result(s) |
Combination treatment with EGCG and dacarbazine strongly inhibits melanoma growth and metastasis, and the action mechanisms of EGCG are associated with the inhibition of cell spreading, cell-extracellular matrix and cell-cell interactions, MMP-9 and FAK activities. | |||||
| Vorinostat | Mycosis fungoides | Click to Show/Hide the Molecular Data of This Drug | ||||
| Augmenting Drug Sensitivity | Click to Show/Hide | |||||
| Representative Experiment Reporting the Effect of This Combination | [15] | |||||
| Detail(s) |
Combination Info
|
|||||
| Molecule(s)
Regulation |
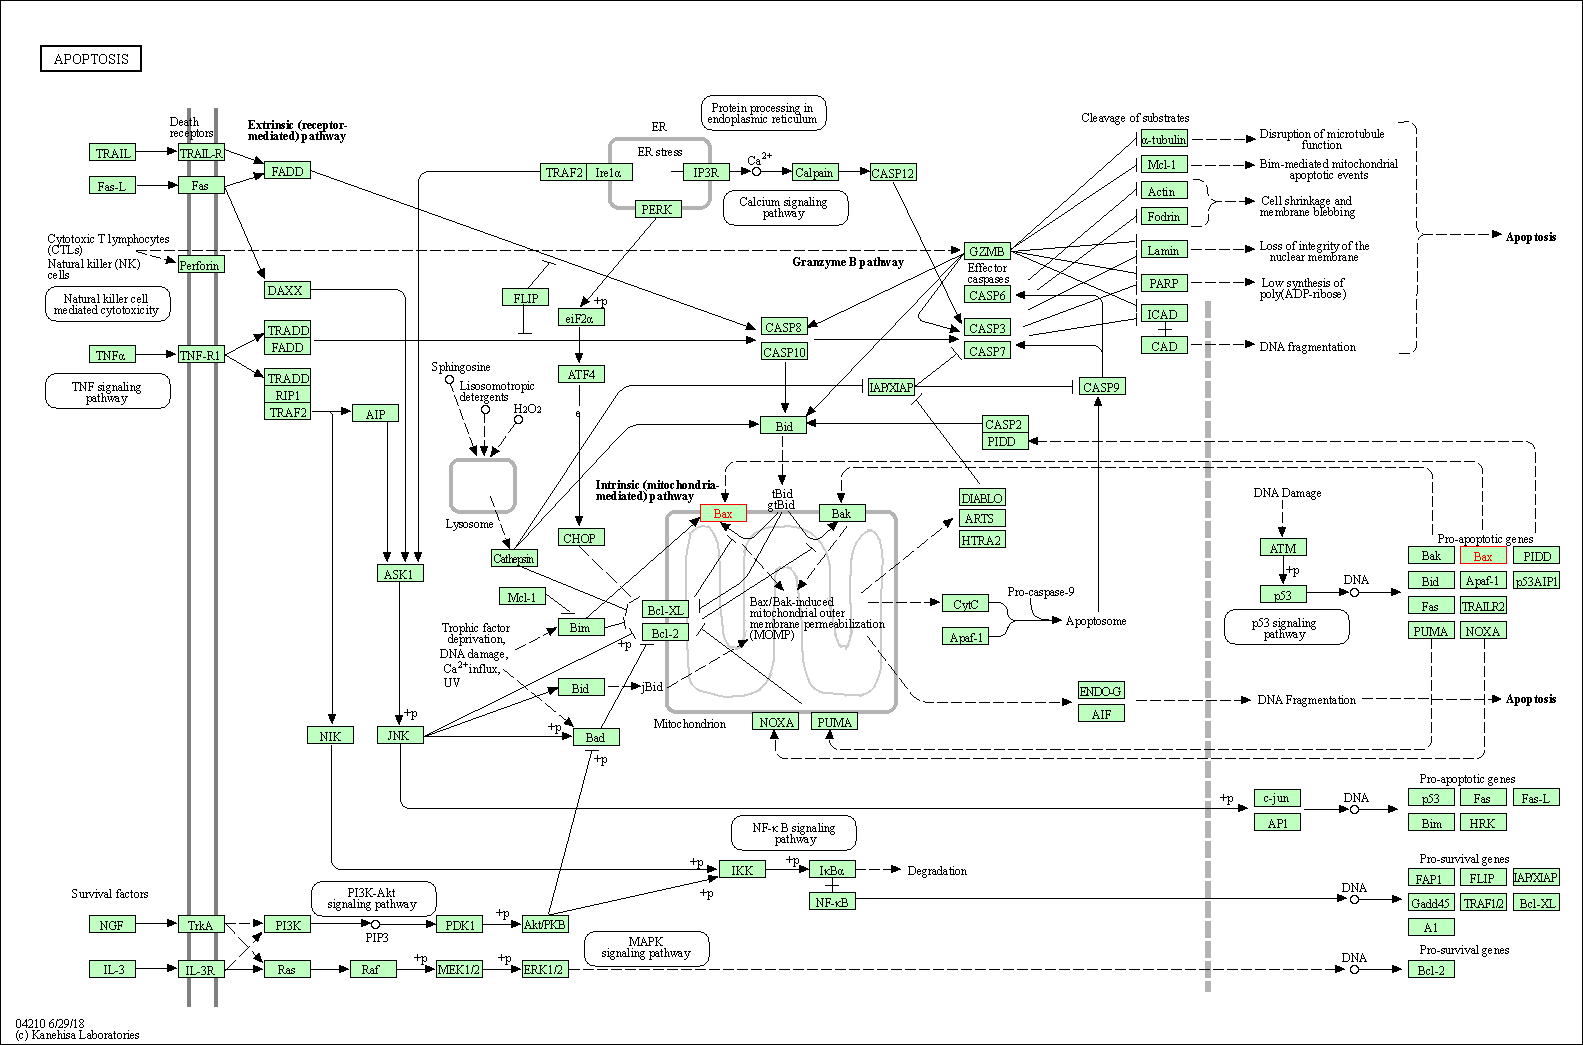
Up-regulation | Expression | BAX | Molecule Info |
Pathway MAP
|
|
| Down-regulation | Expression | BCL-2 | Molecule Info |
Pathway MAP
|
||
| Up-regulation | Activity | CASP3 | Molecule Info |
Pathway MAP
|
||
| Up-regulation | Activity | CASP7 | Molecule Info |
Pathway MAP
|
||
| Up-regulation | Activity | CASP9 | Molecule Info |
Pathway MAP
|
||
| Down-regulation | Expression | CCNA1 | Molecule Info |
Pathway MAP
|
||
| Down-regulation | Expression | CDK2 | Molecule Info |
Pathway MAP
|
||
| Down-regulation | Expression | CDK4 | Molecule Info |
Pathway MAP
|
||
| Up-regulation | Expression | CDKN1A | Molecule Info |
Pathway MAP
|
||
| Down-regulation | Expression | p105 | Molecule Info |
Pathway MAP
|
||
| In-vitro Model | A-375 | CVCL_0132 | Amelanotic melanoma | Homo sapiens | ||
| Hs 294T | CVCL_0331 | Melanoma | Homo sapiens | |||
| G-361 | CVCL_1220 | Melanoma | Homo sapiens | |||
| Experimental
Result(s) |
The combination treatment resulted in significantly greater inhibition of cell proliferation, increased apoptosis, activation of p21, p27 and caspases (3, 7 and 9) and Bax as well as down-regulation of cdk2, cdk4, cyclin A, NF-kappaB protein p65/RelA and Bcl2 protein and transcript. | |||||
| Raloxifene | Osteoporosis | Click to Show/Hide the Molecular Data of This Drug | ||||
| Augmenting Drug Sensitivity | Click to Show/Hide | |||||
| Representative Experiment Reporting the Effect of This Combination | [16] | |||||
| Detail(s) |
Combination Info
|
|||||
| Molecule(s)
Regulation |
Down-regulation | Phosphorylation | AKT1 | Molecule Info |
Pathway MAP
|
|
| Down-regulation | Phosphorylation | EGFR | Molecule Info |
Pathway MAP
|
||
| Up-regulation | Phosphorylation | JNK2 | Molecule Info |
Pathway MAP
|
||
| Down-regulation | Phosphorylation | mTOR | Molecule Info |
Pathway MAP
|
||
| Down-regulation | Phosphorylation | S6K1 | Molecule Info |
Pathway MAP
|
||
| In-vitro Model | MDA-MB-231 | CVCL_0062 | Breast adenocarcinoma | Homo sapiens | ||
| Experimental
Result(s) |
The combination of EGCG and raloxifene effectively reduced the mitogenic and survival signaling in MDA-MB-231 cells. | |||||
| Ibuprofen | Pain | Click to Show/Hide the Molecular Data of This Drug | ||||
| Achieving Therapeutic Synergy | Click to Show/Hide | |||||
| Representative Experiment Reporting the Effect of This Combination | [17] | |||||
| Detail(s) |
Combination Info
|
|||||
| Molecule(s)
Regulation |
Up-regulation | Cleavage | CASP9 | Molecule Info |
Pathway MAP
|
|
| Up-regulation | Expression | TP53 | Molecule Info |
Pathway MAP
|
||
| In-vitro Model | DU145 | CVCL_0105 | Prostate carcinoma | Homo sapiens | ||
| Experimental
Result(s) |
EGCG+ibuprofen treatment has a synergistic effect on apoptosis, and xidative stress, directly or indirectly via ceramide synthesis mediated pro-apoptotic signaling. | |||||
| ONO-8711 | Pain | Click to Show/Hide the Molecular Data of This Drug | ||||
| Achieving Therapeutic Synergy | Click to Show/Hide | |||||
| Representative Experiment Reporting the Effect of This Combination | [18] | |||||
| Detail(s) |
Combination Info
|
|||||
| Molecule(s)
Regulation |
Down-regulation | Expression | BCL-2 | Molecule Info |
Pathway MAP
|
|
| Down-regulation | Expression | CASP3 | Molecule Info |
Pathway MAP
|
||
| Biological
Regulation |
Induction | Cell cycle arrest in G2/M phase | ||||
| Up-regulation | Ratio of Bax to Bcl-2 | |||||
| In-vitro Model | Hep-G2 | CVCL_0027 | Hepatocellular carcinoma | Homo sapiens | ||
| Experimental
Result(s) |
ONO-8711 significantly inhibited PGE2-induced HCC proliferation while increased the inhibitory effect of EGCG on HCC cell viability and migration ability compared with EGCG alone. | |||||
| Bicalutamide | Prostate cancer | Click to Show/Hide the Molecular Data of This Drug | ||||
| Augmenting Drug Sensitivity | Click to Show/Hide | |||||
| Representative Experiment Reporting the Effect of This Combination | [19] | |||||
| Detail(s) |
Combination Info
|
|||||
| Molecule(s)
Regulation |
Down-regulation | Expression | SOD Mn | Molecule Info |
Pathway MAP
|
|
| Biological
Regulation |
Up-regulation | Apoptosis | ||||
| In-vitro Model | NRP-152 | CVCL_4869 | Healthy | Rattus norvegicus | ||
| NRP-154 | CVCL_4870 | Healthy | Rattus norvegicus | |||
| Experimental
Result(s) |
Epigallocatechin-3-gallate and bicalutamide cause growth arrest and apoptosis in NRP-152 and NRP-154 prostate epithelial cells. | |||||
| Celecoxib | Rheumatoid arthritis | Click to Show/Hide the Molecular Data of This Drug | ||||
| Achieving Therapeutic Synergy | Click to Show/Hide | |||||
| Representative Experiment Reporting the Effect of This Combination | [20] | |||||
| Detail(s) |
Combination Info
|
|||||
| Molecule(s)
Regulation |
Down-regulation | Expression | IL6 | Molecule Info |
Pathway MAP
|
|
| Down-regulation | Expression | MMP-2 | Molecule Info |
Pathway MAP
|
||
| Down-regulation | Expression | VEGFA | Molecule Info |
Pathway MAP
|
||
| In-vitro Model | COLO 357 | CVCL_0221 | Pancreatic adenosquamous carcinoma | Homo sapiens | ||
| Experimental
Result(s) |
EGCG synergistically boosts celecoxib-mediated effects and reduces the levels of celecoxib required to elicit beneficial effects on tumorigenic mediators by a factor of ten. | |||||
| Gemcitabine | Solid tumour/cancer | Click to Show/Hide the Molecular Data of This Drug | ||||
| Augmenting Drug Sensitivity | Click to Show/Hide | |||||
| Representative Experiment Reporting the Effect of This Combination | [21] | |||||
| Detail(s) |
Combination Info
|
|||||
| Molecule(s)
Regulation |
Down-regulation | Phosphorylation | AKT1 | Molecule Info |
Pathway MAP
|
|
| Down-regulation | Expression | CDH2 | Molecule Info |
Pathway MAP
|
||
| Down-regulation | Expression | VIM | Molecule Info |
Pathway MAP
|
||
| In-vitro Model | PANC-1 | CVCL_0480 | Pancreatic ductal adenocarcinoma | Homo sapiens | ||
| MIA PaCa-2 | CVCL_0428 | Pancreatic ductal adenocarcinoma | Homo sapiens | |||
| BxPC-3 | CVCL_0186 | Pancreatic ductal adenocarcinoma | Homo sapiens | |||
| HPAF-II | CVCL_0313 | Pancreatic ductal adenocarcinoma | Homo sapiens | |||
| CFPAC-1 | CVCL_1119 | Cystic fibrosis | Homo sapiens | |||
| SU.86.86 | CVCL_3881 | Pancreatic adenocarcinoma | Homo sapiens | |||
| KPC3 | CVCL_A9ZK | Mouse pancreatic neoplasm | Mus musculus | |||
| In-vivo Model | C57BL/6J mice (4-6 weeks) were injected subcutaneously with 0.3*106 KPC cells per tumor suspended in 100L of sterile PBS. | |||||
| Experimental
Result(s) |
EGCG synergized with gemcitabine to suppress pancreatic cancer cell growth, migration, and invasion, through modulating epithelial-mesenchymal transition markers and inhibiting Akt pathway. | |||||
| Trichostatin A | Solid tumour/cancer | Click to Show/Hide the Molecular Data of This Drug | ||||
| Achieving Therapeutic Synergy | Click to Show/Hide | |||||
| Representative Experiment Reporting the Effect of This Combination | [22] | |||||
| Detail(s) |
Combination Info
|
|||||
| Molecule(s)
Regulation |
Down-regulation | Expression | CDKN2A | Molecule Info |
Pathway MAP
|
|
| In-vitro Model | CA46 | CVCL_1101 | Burkitt lymphoma | Homo sapiens | ||
| Experimental
Result(s) |
Epigallocatechin-3-gallate and trichostatin A synergistically inhibit human lymphoma cell proliferation through epigenetic modification of p16INK4a. | |||||
| SU5416 | Thrombocytopenia | Click to Show/Hide the Molecular Data of This Drug | ||||
| Achieving Therapeutic Synergy | Click to Show/Hide | |||||
| Representative Experiment Reporting the Effect of This Combination | [23] | |||||
| Detail(s) |
Combination Info
|
|||||
| Molecule(s)
Regulation |
Down-regulation | Expression | BCL-2 | Molecule Info |
Pathway MAP
|
|
| Up-regulation | Cleavage | CASP3 | Molecule Info |
Pathway MAP
|
||
| Down-regulation | Expression | CDK2 | Molecule Info |
Pathway MAP
|
||
| Up-regulation | Expression | CDKN1A | Molecule Info |
Pathway MAP
|
||
| Down-regulation | Expression | EGFR | Molecule Info |
Pathway MAP
|
||
| Down-regulation | Expression | FGF2 | Molecule Info |
Pathway MAP
|
||
| Up-regulation | Cleavage | PARP1 | Molecule Info |
Pathway MAP
|
||
| Down-regulation | Expression | VEGFA | Molecule Info |
Pathway MAP
|
||
| In-vitro Model | SH-SY5Y | CVCL_0019 | Neuroblastoma | Homo sapiens | ||
| SK-N-BE(2) | CVCL_0528 | Neuroblastoma | Homo sapiens | |||
| Experimental
Result(s) |
SU5416 and EGCG work synergistically and inhibit angiogenic and survival factors and induce cell cycle arrest to promote apoptosis in human malignant neuroblastoma SH-SY5Y and SK-N-BE2 cells. | |||||
| Enoxacin | Urinary tract infection | Click to Show/Hide the Molecular Data of This Drug | ||||
| Achieving Therapeutic Synergy | Click to Show/Hide | |||||
| Representative Experiment Reporting the Effect of This Combination | [24] | |||||
| Detail(s) |
Combination Info
|
|||||
| Molecule(s)
Regulation |
Up-regulation | Cleavage | CASP3 | Molecule Info |
Pathway MAP
|
|
| Up-regulation | Cleavage | CASP7 | Molecule Info |
Pathway MAP
|
||
| Up-regulation | Cleavage | CASP9 | Molecule Info |
Pathway MAP
|
||
| Up-regulation | Cleavage | PARP1 | Molecule Info |
Pathway MAP
|
||
| In-vitro Model | HeLa | CVCL_0030 | Endocervical adenocarcinoma | Homo sapiens | ||
| C-33 A | CVCL_1094 | Cervical squamous cell carcinoma | Homo sapiens | |||
| WI-38 | CVCL_0579 | Healthy | Homo sapiens | |||
| Experimental
Result(s) |
EGCG functions synergistically against cancer cell proliferation in combined treatment with enoxacin. | |||||
| 4-hydroxy-tamoxifen | Cyclic Mastalgia | Click to Show/Hide the Molecular Data of This Drug | ||||
| Achieving Therapeutic Synergy | Click to Show/Hide | |||||
| Representative Experiment Reporting the Effect of This Combination | [25] | |||||
| Detail(s) |
Combination Info
|
|||||
| Biological
Regulation |
Induction | Apoptosis | ||||
| In-vitro Model | MDA-MB-231 | CVCL_0062 | Breast adenocarcinoma | Homo sapiens | ||
| Experimental
Result(s) |
The synergistic cytotoxicity elicited by the combination of EGCG and 4-OHT results from an earlier induction of apoptosis but this was not caused by an increase in G1-arrest or 4-OHT-mediated changes in the metabolism of EGCG. | |||||
| Sulindac | Rheumatoid arthritis | Click to Show/Hide the Molecular Data of This Drug | ||||
| Achieving Therapeutic Synergy | Click to Show/Hide | |||||
| Representative Experiment Reporting the Effect of This Combination | [26] | |||||
| Detail(s) |
Combination Info
|
|||||
| Biological
Regulation |
Up-regulation | Apoptosis | ||||
| In-vivo Model | Colon carcinogenesis in five-week-old male was induced by azoxymethane. | |||||
| Experimental
Result(s) |
EGCG with sulindac synergistically suppresses ACF formation by enhancing apoptosis. | |||||
| Tapentadol | Acute pain | Click to Show/Hide the Molecular Data of This Drug | ||||
| Augmenting Drug Sensitivity | Click to Show/Hide | |||||
| Representative Experiment Reporting the Effect of This Combination | [27] | |||||
| Detail(s) |
Combination Info
|
|||||
| In-vitro Model | MDA-MB-231 | CVCL_0062 | Breast adenocarcinoma | Homo sapiens | ||
| Experimental
Result(s) |
EGCG and TAP reduced the proliferation of MDA-MB-231 cells by impairing cell-cycle progression. | |||||
| β. A List of Drug(s) Whose Resistance can be Reversed by This NP | ||||||
| Cisplatin | Bladder cancer | Click to Show/Hide the Molecular Data of This Drug | ||||
| Reversing Drug Resistance | Click to Show/Hide | |||||
| Representative Experiment Reporting the Effect of This Combination | [28] | |||||
| Detail(s) |
Combination Info
|
|||||
| Molecule(s)
Regulation |
Down-regulation | Expression | AXL | Molecule Info |
Pathway MAP
|
|
| Down-regulation | Expression | TYRO3 | Molecule Info | |||
| In-vitro Model | A-549 | CVCL_0023 | Lung adenocarcinoma | Homo sapiens | ||
| NCI-H460 | CVCL_0459 | Lung large cell carcinoma | Homo sapiens | |||
| Experimental
Result(s) |
Reversal of cisplatin resistance by epigallocatechin gallate is mediated by downregulation of axl and tyro 3 expression in human lung cancer cells. | |||||
| Gefitinib | Lung cancer | Click to Show/Hide the Molecular Data of This Drug | ||||
| Reversing Drug Resistance | Click to Show/Hide | |||||
| Representative Experiment Reporting the Effect of This Combination | [29] | |||||
| Detail(s) |
Combination Info
|
|||||
| Molecule(s)
Regulation |
Down-regulation | Phosphorylation | ERK1 | Molecule Info |
Pathway MAP
|
|
| Up-regulation | Expression | SQSTM1 | Molecule Info |
Pathway MAP
|
||
| In-vitro Model | A-549 | CVCL_0023 | Lung adenocarcinoma | Homo sapiens | ||
| In-vivo Model | A549 cells were injected subcutaneously (1*106, 100 uL of PBS) into the left flanks of the 7-8-week old BALB/C male nude mice. | |||||
| Experimental
Result(s) |
EGCG overcomes gefitinib resistance by inhibiting autophagy and augmenting cell death through targeting ERK phosphorylation in NSCLC. | |||||
| 5-fluorouracil | Solid tumour/cancer | Click to Show/Hide the Molecular Data of This Drug | ||||
| Reversing Drug Resistance | Click to Show/Hide | |||||
| Representative Experiment Reporting the Effect of This Combination | [30] | |||||
| Detail(s) |
Combination Info
|
|||||
| Molecule(s)
Regulation |
Down-regulation | Expression | ABCB1 | Molecule Info |
Pathway MAP
|
|
| Down-regulation | Expression | ABCB1 | Molecule Info |
Pathway MAP
|
||
| Down-regulation | Expression | TFAP2A | Molecule Info | |||
| Down-regulation | Expression | VEGFA | Molecule Info |
Pathway MAP
|
||
| In-vitro Model | SGC-7901 | CVCL_0520 | Human gastric cancer | Homo sapiens | ||
| MGC-803 | CVCL_5334 | Gastric mucinous adenocarcinoma | Homo sapiens | |||
| In-vivo Model | Exponentially growing SCG7901/FU cells (5*106) were injected subcutaneously into the dorsum of female BALB/c nude mice. | |||||
| Experimental
Result(s) |
Reversal of 5-fluorouracil resistance by EGCG is mediate by inactivation of TFAP2A/VEGF signaling pathway and down-regulation of MDR-1 and P-gp expression in gastric cancer. | |||||
| Doxorubicin | Solid tumour/cancer | Click to Show/Hide the Molecular Data of This Drug | ||||
| Reversing Drug Resistance | Click to Show/Hide | |||||
| Representative Experiment Reporting the Effect of This Combination | [31] | |||||
| Detail(s) |
Combination Info
|
|||||
| Biological
Regulation |
Up-regulation | DOX accumulation | ||||
| In-vitro Model | KB-A1 | CVCL_1D82 | Human oral epidermoid carcinoma | Homo sapiens | ||
| In-vivo Model | About 5 x10⁶ cells were subcutaneously injected into the right flank of the athymic male nude mice. | |||||
| Experimental
Result(s) |
EGCG could chemosensitize resistant tumor cells to DOX in vivo through an increase in the accumulation of DOX in the tumors. | |||||
| Target and Pathway | ||||
|---|---|---|---|---|
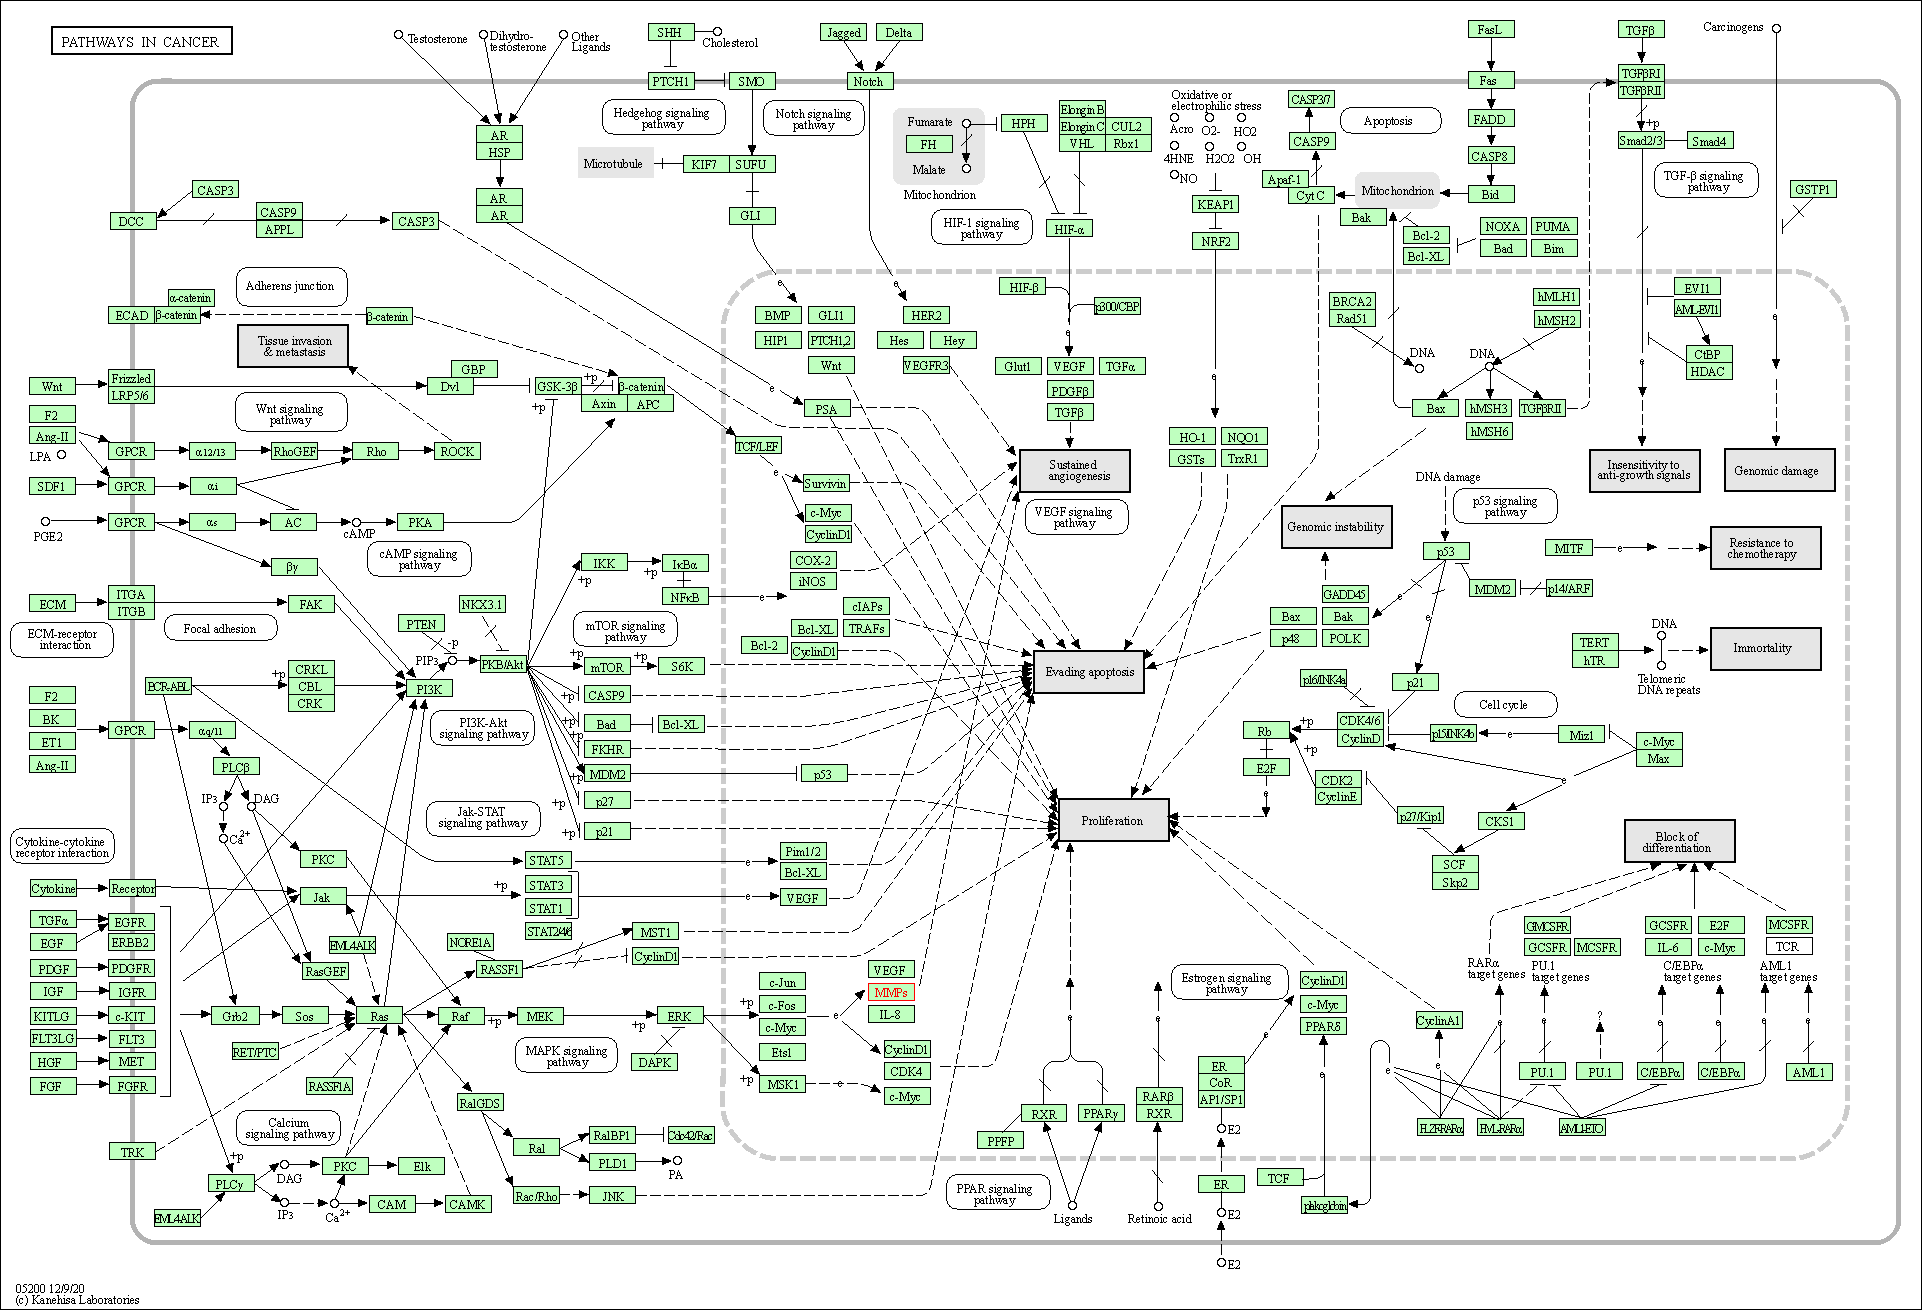
| Target(s) | Fatty acid synthase (FASN) | Molecule Info | [32] | |
| HIV reverse transcriptase (HIV RT) | Molecule Info | [33] | ||
| Matrix metalloproteinase-14 (MMP-14) | Molecule Info | [34] | ||
| Matrix metalloproteinase-2 (MMP-2) | Molecule Info | [34] | ||
| Neutrophil elastase (NE) | Molecule Info | [35] | ||
| Plasmodium 3-oxoacyl-acyl-carrier reductase (Malaria fabG) | Molecule Info | [32] | ||
| Plasmodium enoyl-ACP reductase (Malaria fabI) | Molecule Info | [36] | ||
| Plasmodium Fatty acid synthesis protein (Malaria FabZ) | Molecule Info | [32] | ||
| Squalene monooxygenase (SQLE) | Molecule Info | [2] | ||
| BioCyc | Fatty acid biosynthesis initiation | Click to Show/Hide | ||
| 2 | Fatty acid elongation -- saturated | |||
| 3 | Palmitate biosynthesis | |||
| KEGG Pathway | Fatty acid biosynthesis | Click to Show/Hide | ||
| 2 | Metabolic pathways | |||
| 3 | Fatty acid metabolism | |||
| 4 | AMPK signaling pathway | |||
| 5 | Insulin signaling pathway | |||
| 6 | Leukocyte transendothelial migration | |||
| 7 | GnRH signaling pathway | |||
| 8 | Estrogen signaling pathway | |||
| 9 | Pathways in cancer | |||
| 10 | Proteoglycans in cancer | |||
| 11 | Bladder cancer | |||
| 12 | Transcriptional misregulation in cancer | |||
| 13 | Systemic lupus erythematosus | |||
| 14 | Steroid biosynthesis | |||
| 15 | Sesquiterpenoid and triterpenoid biosynthesis | |||
| 16 | Metabolic pathways | |||
| 17 | Biosynthesis of secondary metabolites | |||
| 18 | Biosynthesis of antibiotics | |||
| 19 | TNF signaling pathway | |||
| 20 | Fatty acid biosynthesis | |||
| 21 | Biotin metabolism | |||
| 22 | Metabolic pathways | |||
| 23 | Fatty acid metabolism | |||
| NetPath Pathway | Leptin Signaling Pathway | Click to Show/Hide | ||
| 2 | TCR Signaling Pathway | |||
| 3 | ID Signaling Pathway | |||
| Panther Pathway | Alzheimer disease-presenilin pathway | Click to Show/Hide | ||
| Pathwhiz Pathway | Fatty Acid Biosynthesis | Click to Show/Hide | ||
| 2 | Steroid Biosynthesis | |||
| Pathway Interaction Database | p73 transcription factor network | Click to Show/Hide | ||
| 2 | Validated transcriptional targets of deltaNp63 isoforms | |||
| 3 | LPA receptor mediated events | |||
| 4 | Plasma membrane estrogen receptor signaling | |||
| 5 | Osteopontin-mediated events | |||
| 6 | Validated transcriptional targets of AP1 family members Fra1 and Fra2 | |||
| 7 | Angiopoietin receptor Tie2-mediated signaling | |||
| 8 | Direct p53 effectors | |||
| 9 | amb2 Integrin signaling | |||
| 10 | ATF-2 transcription factor network | |||
| 11 | FOXM1 transcription factor network | |||
| 12 | Regulation of nuclear beta catenin signaling and target gene transcription | |||
| 13 | Syndecan-2-mediated signaling events | |||
| 14 | Urokinase-type plasminogen activator (uPA) and uPAR-mediated signaling | |||
| 15 | C-MYB transcription factor network | |||
| 16 | HIF-2-alpha transcription factor network | |||
| 17 | Signaling events mediated by focal adhesion kinase | |||
| Reactome | ChREBP activates metabolic gene expression | Click to Show/Hide | ||
| 2 | Activation of gene expression by SREBF (SREBP) | |||
| 3 | Fatty Acyl-CoA Biosynthesis | |||
| 4 | Collagen degradation | |||
| 5 | Degradation of the extracellular matrix | |||
| 6 | Activation of Matrix Metalloproteinases | |||
| 7 | Regulation of Insulin-like Growth Factor (IGF) transport and uptake by Insulin-like Growth Factor Binding Proteins (IGFBPs) | |||
| 8 | EPH-ephrin mediated repulsion of cells | |||
| 9 | Cholesterol biosynthesis | |||
| WikiPathways | Fatty Acid Biosynthesis | Click to Show/Hide | ||
| 2 | Nuclear Receptors Meta-Pathway | |||
| 3 | Liver X Receptor Pathway | |||
| 4 | Activation of Gene Expression by SREBP (SREBF) | |||
| 5 | SREBF and miR33 in cholesterol and lipid homeostasis | |||
| 6 | SREBP signalling | |||
| 7 | Metabolism of water-soluble vitamins and cofactors | |||
| 8 | Integration of energy metabolism | |||
| 9 | Fatty acid, triacylglycerol, and ketone body metabolism | |||
| 10 | AMPK Signaling | |||
| 11 | Activation of Matrix Metalloproteinases | |||
| 12 | AGE/RAGE pathway | |||
| 13 | Matrix Metalloproteinases | |||
| 14 | Hair Follicle Development: Cytodifferentiation (Part 3 of 3) | |||
| 15 | Human Complement System | |||
| 16 | Degradation of collagen | |||
| 17 | Senescence and Autophagy in Cancer | |||